
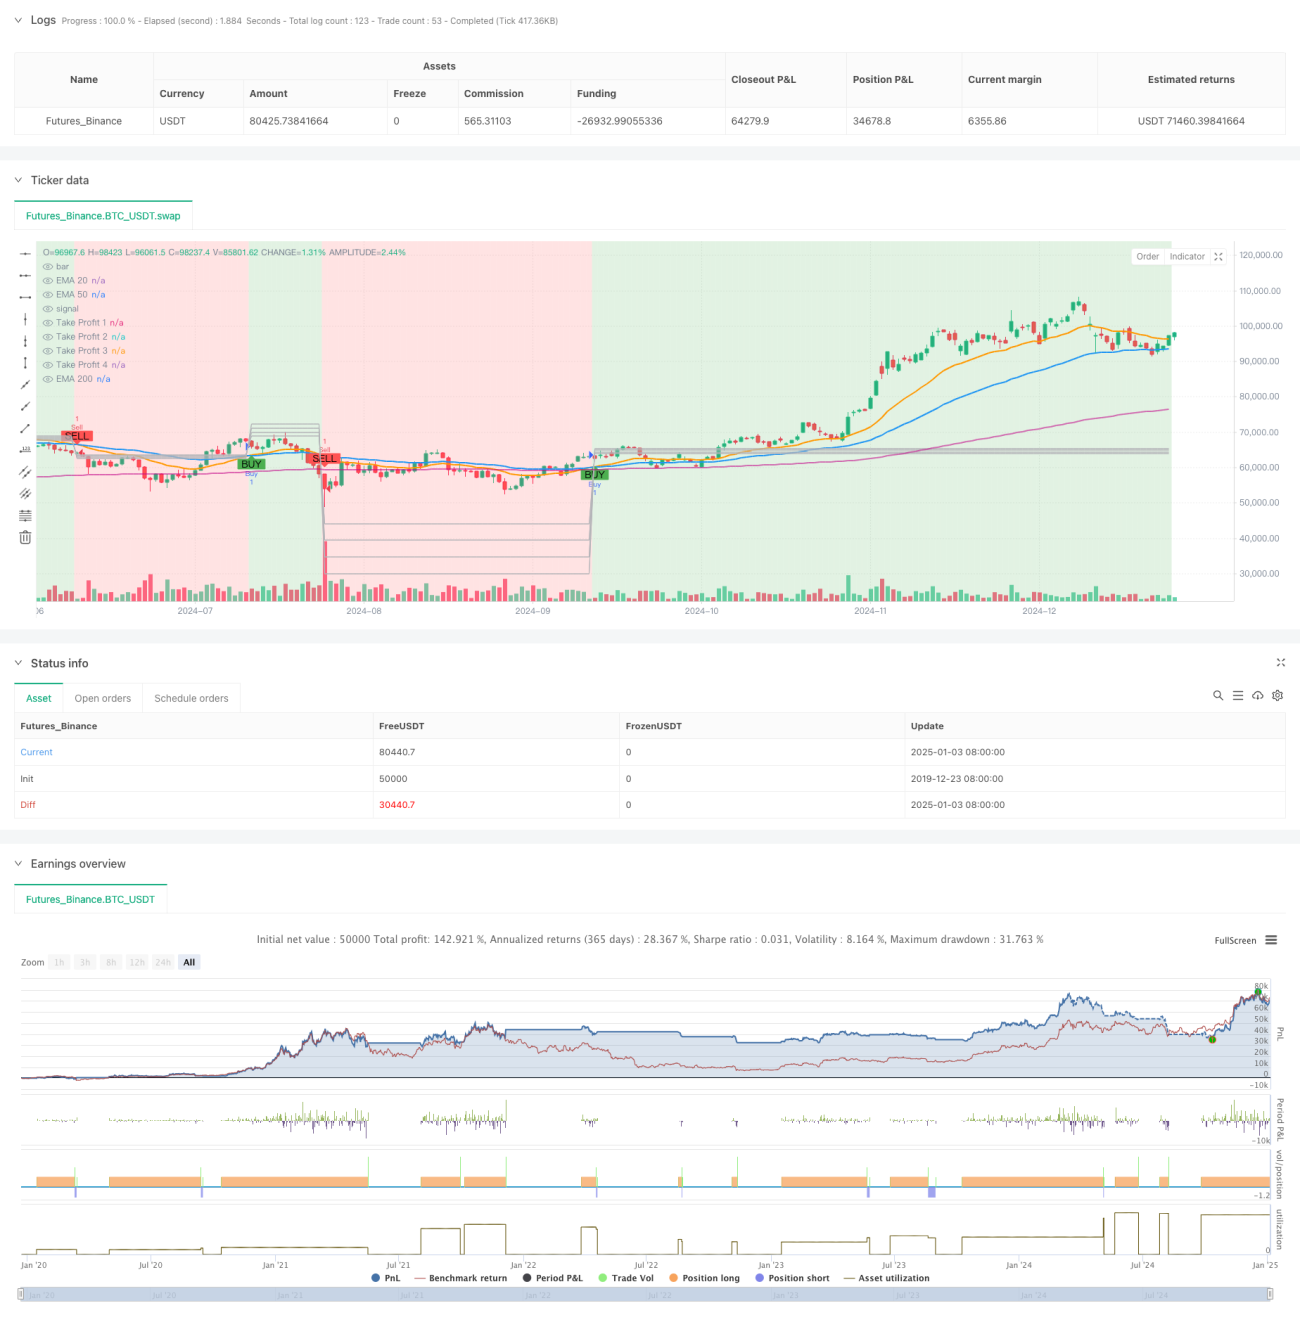
This strategy is a trading system based on Exponential Moving Averages (EMA), primarily utilizing the crossover of EMA20 and EMA50 to identify market trend changes. The strategy features dynamic multi-level take-profit points combined with a stop-loss mechanism for risk control. The system visually displays market trend direction through background color changes, helping traders better grasp market movements.
The core logic of the strategy is based on the following aspects: 1. Using EMA20 and EMA50 crossovers to determine trend direction: generating buy signals when EMA20 crosses above EMA50, and sell signals when it crosses below 2. Dynamically setting four take-profit targets based on the previous candle’s range: - TP1 set at 0.5x range - TP2 set at 1.0x range - TP3 set at 1.5x range - TP4 set at 2.0x range 3. Setting a 3% stop-loss point for risk control 4. Displaying trend direction through candle background colors: green for uptrend and red for downtrend
This is a well-structured trend-following strategy with clear logic. It captures trends through EMA crossovers, manages profits with dynamic take-profit points, and controls risk with stop-losses. The strategy’s visualization design is intuitive and effective, with flexible parameter settings. While it has inherent EMA lag issues, optimization and refinement can further enhance the strategy’s stability and profitability.
/*backtest
start: 2019-12-23 08:00:00
end: 2025-01-04 08:00:00
period: 1d
basePeriod: 1d
exchanges: [{"eid":"Futures_Binance","currency":"BTC_USDT"}]
*/
//@version=5
strategy("EMA Crossover Strategy with Take Profit and Candle Highlighting", overlay=true)
// Define the EMAs
ema200 = ta.ema(close, 200)
ema50 = ta.ema(close, 50)
ema20 = ta.ema(close, 20)
// Plot the EMAs
plot(ema200, color=#c204898e, title="EMA 200", linewidth=2)
plot(ema50, color=color.blue, title="EMA 50", linewidth=2)
plot(ema20, color=color.orange, title="EMA 20", linewidth=2)
// Define Buy and Sell conditions based on EMA crossover
buySignal = ta.crossover(ema20, ema50) // EMA 20 crosses above EMA 50 (Bullish)
sellSignal = ta.crossunder(ema20, ema50) // EMA 20 crosses below EMA 50 (Bearish)
// Define input values for Take Profit multipliers
tp1_multiplier = input.float(0.5, title="TP1 Multiplier", minval=0.1, maxval=5.0, step=0.1)
tp2_multiplier = input.float(1.0, title="TP2 Multiplier", minval=0.1, maxval=5.0, step=0.1)
tp3_multiplier = input.float(1.5, title="TP3 Multiplier", minval=0.1, maxval=5.0, step=0.1)
tp4_multiplier = input.float(2.0, title="TP4 Multiplier", minval=0.1, maxval=5.0, step=0.1)
// Define Take Profit Levels as float variables initialized with na
var float takeProfit1 = na
var float takeProfit2 = na
var float takeProfit3 = na
var float takeProfit4 = na
// Calculate take profit levels based on the multipliers
if buySignal
takeProfit1 := high + (high - low) * tp1_multiplier // TP1: Set TP at multiplier of previous range above the high
takeProfit2 := high + (high - low) * tp2_multiplier // TP2: Set TP at multiplier of previous range above the high
takeProfit3 := high + (high - low) * tp3_multiplier // TP3: Set TP at multiplier of previous range above the high
takeProfit4 := high + (high - low) * tp4_multiplier // TP4: Set TP at multiplier of previous range above the high
if sellSignal
takeProfit1 := low - (high - low) * tp1_multiplier // TP1: Set TP at multiplier of previous range below the low
takeProfit2 := low - (high - low) * tp2_multiplier // TP2: Set TP at multiplier of previous range below the low
takeProfit3 := low - (high - low) * tp3_multiplier // TP3: Set TP at multiplier of previous range below the low
takeProfit4 := low - (high - low) * tp4_multiplier // TP4: Set TP at multiplier of previous range below the low
// Plot Take Profit Levels on the chart
plot(takeProfit1, color=#b4b4b8, style=plot.style_line, linewidth=1, title="Take Profit 1")
plot(takeProfit2, color=#b4b4b8, style=plot.style_line, linewidth=1, title="Take Profit 2")
plot(takeProfit3, color=#b4b4b8, style=plot.style_line, linewidth=1, title="Take Profit 3")
plot(takeProfit4, color=#b4b4b8, style=plot.style_line, linewidth=1, title="Take Profit 4")
// Create buy and sell signals on the chart
plotshape(series=buySignal, location=location.belowbar, color=color.green, style=shape.labelup, title="Buy Signal", text="BUY")
plotshape(series=sellSignal, location=location.abovebar, color=color.red, style=shape.labeldown, title="Sell Signal", text="SELL")
// Highlight the candles based on trend direction
uptrend = ta.crossover(ema20, ema50) // EMA 20 crosses above EMA 50 (Bullish)
downtrend = ta.crossunder(ema20, ema50) // EMA 20 crosses below EMA 50 (Bearish)
// Highlighting candles based on trend
bgcolor(color = ema20 > ema50 ? color.new(color.green, 80) : ema20 < ema50 ? color.new(color.red, 80) : na)
// Execute buy and sell orders on the chart
strategy.entry("Buy", strategy.long, when=buySignal)
strategy.entry("Sell", strategy.short, when=sellSignal)
// Exit conditions based on Take Profit levels
strategy.exit("Take Profit 1", "Buy", limit=takeProfit1)
strategy.exit("Take Profit 2", "Buy", limit=takeProfit2)
strategy.exit("Take Profit 3", "Buy", limit=takeProfit3)
strategy.exit("Take Profit 4", "Buy", limit=takeProfit4)
strategy.exit("Take Profit 1", "Sell", limit=takeProfit1)
strategy.exit("Take Profit 2", "Sell", limit=takeProfit2)
strategy.exit("Take Profit 3", "Sell", limit=takeProfit3)
strategy.exit("Take Profit 4", "Sell", limit=takeProfit4)
// Optionally, add a stop loss
stopLoss = 0.03 // Example: 3% stop loss
strategy.exit("Stop Loss", "Buy", stop=close * (1 - stopLoss))
strategy.exit("Stop Loss", "Sell", stop=close * (1 + stopLoss))