
Overview
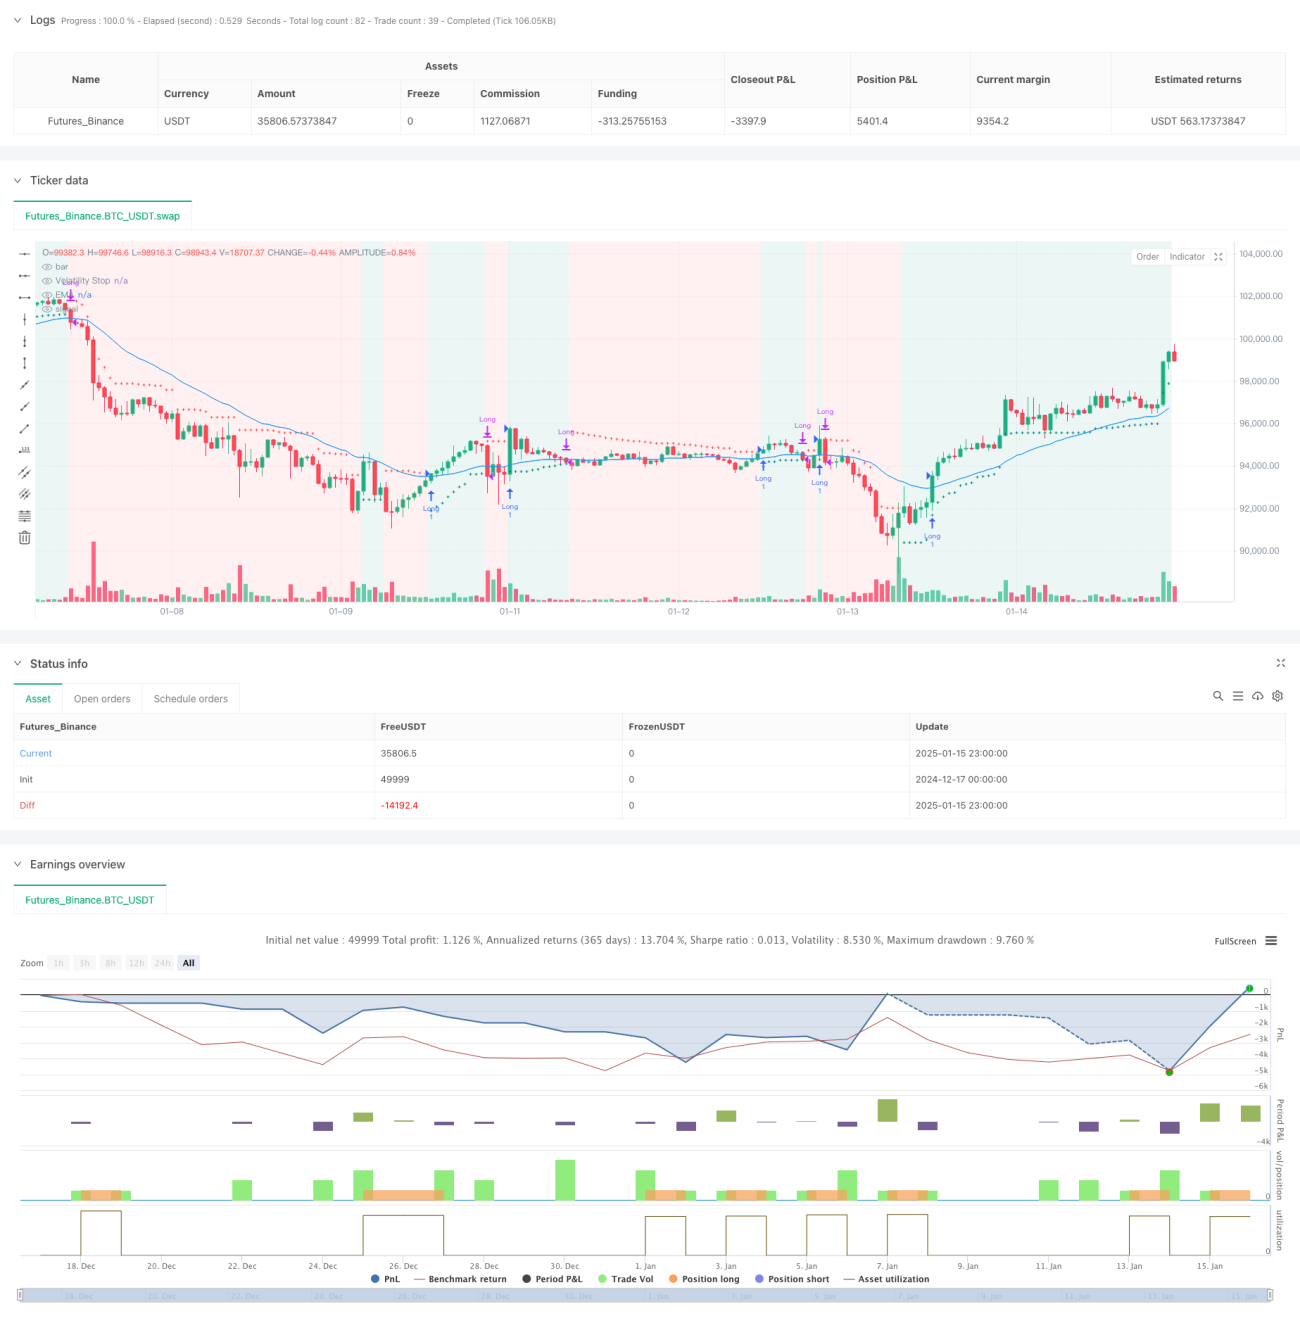
This strategy is a trend following trading system based on the Volatility Stop (VStop) indicator and Exponential Moving Average (EMA). Incorporating Stan Weinstein's trading principles, it optimizes capital management through dynamically adjusted stop losses while using EMA to confirm trend direction. This combination provides investors and swing traders with a framework that can both capture trends and effectively manage risks.
Strategy Principles
The core logic is built on two main technical indicators:
-
Volatility Stop (VStop): A dynamic stop-loss indicator based on ATR (Average True Range) that adapts to market volatility. When price is in an uptrend, the stop line moves up with price; when the trend reverses, the stop line switches direction and recalculates.
-
Exponential Moving Average (EMA): Serves as a trend confirmation tool to filter false signals. Price must be above EMA to consider entry positions, ensuring trade direction aligns with the main trend.
Trade signal generation logic:
- Entry conditions: Price above VStop (in uptrend) and closing price above EMA
- Exit conditions: When closing price falls below EMA
- Risk control: Real-time stop-loss positions provided by dynamically adjusted VStop
Strategy Advantages
- Strong adaptability: VStop calculates based on actual market volatility, automatically adjusting stop distances for different market environments
- Excellent trend following capability: Confirms trend direction through EMA, avoiding frequent trading in oscillating markets
- Comprehensive risk management: Dynamic stop-loss mechanism locks in profits and controls drawdowns
- Strong parameter adjustability: Flexible adjustment of VStop and EMA parameters for different trading instruments and timeframes
- Clear and concise logic: Strategy rules are intuitive and easy to implement
Strategy Risks
- Trend reversal risk: May experience some drawdown before exiting during sharp trend reversals
- False breakout risk: May generate false breakthrough signals during market oscillation, leading to frequent trading
- Parameter sensitivity: Different parameter settings may result in significant strategy performance variations
- Slippage risk: Actual execution prices may deviate from theoretical prices in markets with insufficient liquidity
- Systematic risk: May face significant drawdowns during severe market volatility
Strategy Optimization Directions
- Add trend strength filter: Introduce indicators like ADX, MACD to measure trend strength, trading only when trends are clear
- Optimize stop-loss mechanism: Set more intelligent stop-loss positions combining support and resistance levels
- Incorporate volume analysis: Confirm price breakout validity through volume
- Introduce market environment recognition: Dynamically adjust strategy parameters based on different market environments (trend/oscillation)
- Improve position management: Dynamically adjust position size based on volatility and risk assessment
Summary
This strategy constructs a complete trend following trading framework by combining volatility stops and moving average systems. Its main advantages lie in adaptability and risk management capabilities, but attention must be paid to the impact of market environment on strategy performance. Through continuous optimization and improvement, the strategy has the potential to maintain stable performance in different market environments. Traders are advised to thoroughly test parameter settings and adjust the strategy according to their risk tolerance before live trading.
- 1