
Overview
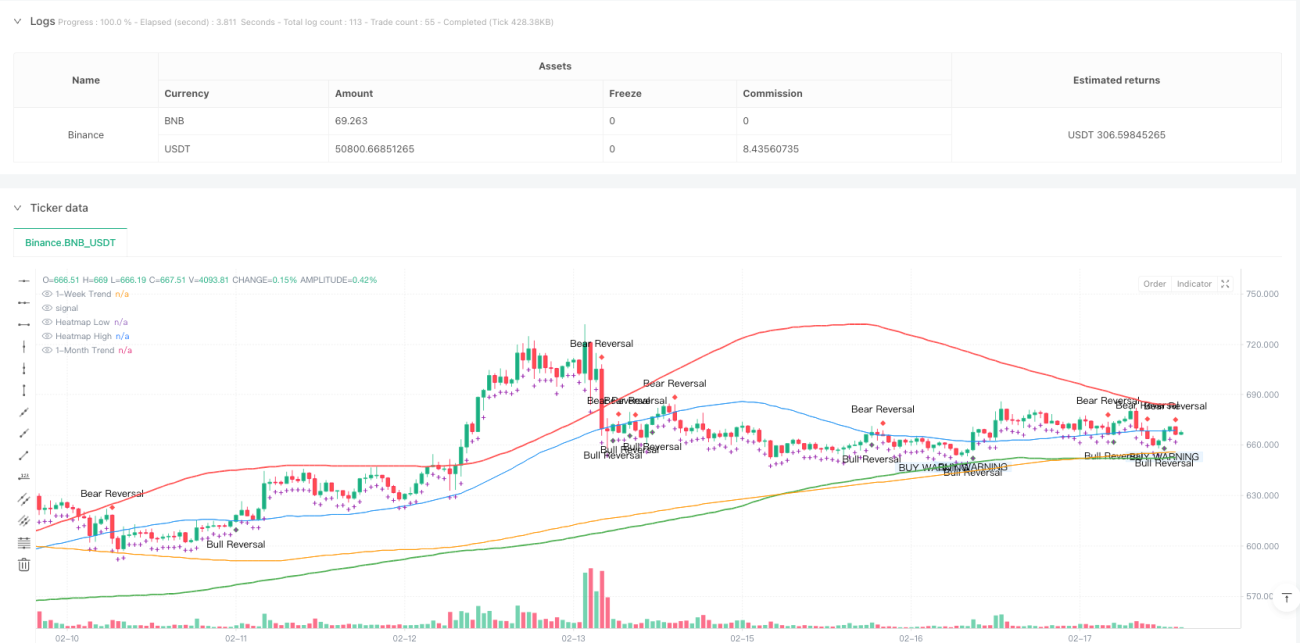
This is a high-frequency quantitative trading strategy based on heatmap and multi-timeframe trend analysis. The strategy achieves precise market entry timing by combining heatmap support/resistance zones, weekly and monthly moving averages, and an early warning signal system. The core lies in identifying key price areas through heatmap technology and using multi-timeframe trend confirmation to improve trading accuracy.
Strategy Principles
The strategy is based on several core components:
- Heatmap Trading Zones: Calculate support and resistance levels using moving averages of highs and lows to form trading heatmaps.
- Multi-timeframe Trend Confirmation: Use weekly and monthly moving averages to judge market trends.
- Early Warning Signal System: Provide warnings before actual trade signals to help traders prepare.
- Trend Projection Trail: Show potential price movement direction through purple cross markers.
- Bull and Bear Reversal Indicators: Display potential trend reversal points through diamond-shaped markers.
Strategy Advantages
- Multi-dimensional Analysis: Combines heatmap, trend, and reversal signals for comprehensive market insights.
- Warning Mechanism: Provides early warnings through warning bubbles to avoid hasty decisions.
- Adaptability: Can operate across multiple timeframes, adapting to different trading styles.
- Visualization: Clear visual indicator system for quick decision making.
- Risk Control: Reduces false signal risk through multiple confirmation mechanisms.
Strategy Risks
- Market Volatility Risk: May generate false signals during high volatility periods.
- Parameter Sensitivity: Strategy performance heavily depends on heatmap sensitivity and moving average period selection.
- Slippage Risk: High-frequency trading may face significant slippage.
- Trading Costs: Frequent trading may incur high transaction costs.
- Market Environment Dependency: Strategy may not perform well in certain market conditions.
Strategy Optimization Directions
- Dynamic Parameter Adjustment: Introduce adaptive parameter system to adjust heatmap sensitivity based on market volatility.
- Signal Filtering: Add volume and volatility filters to reduce false signals.
- Risk Management: Incorporate dynamic stop-loss and profit target management system.
- Market Environment Recognition: Develop market environment recognition module to automatically stop trading in unsuitable conditions.
- Machine Learning Optimization: Introduce machine learning algorithms to optimize parameter selection and signal confirmation.
Summary
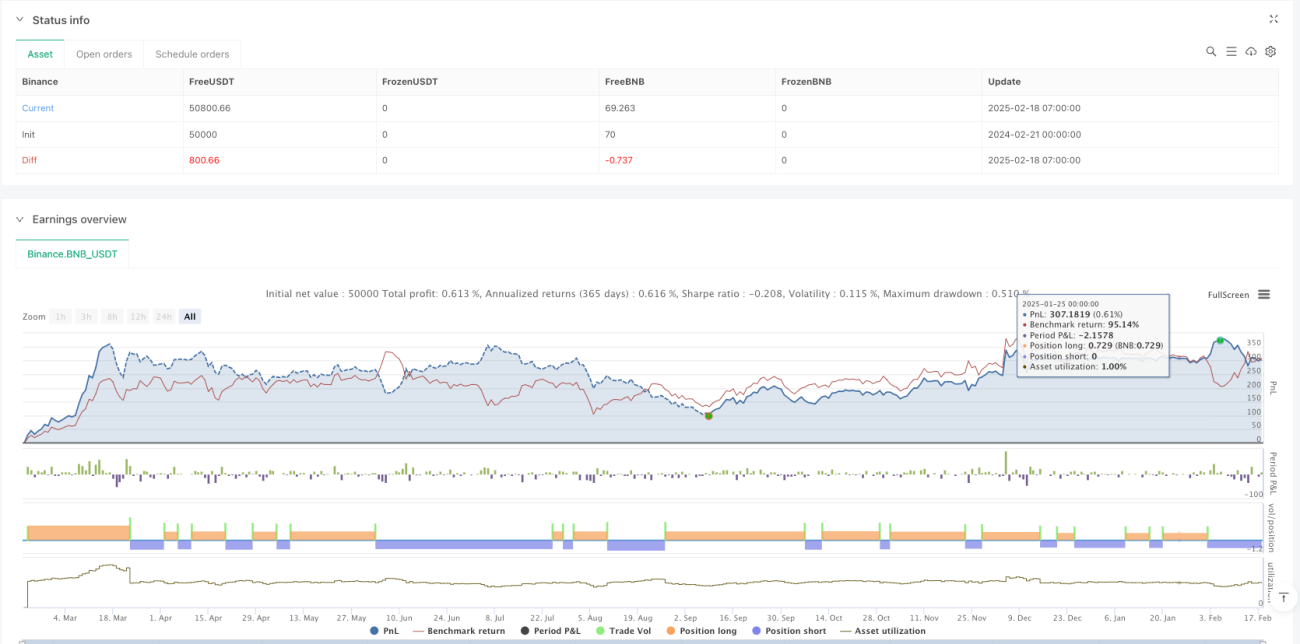
The High-Frequency Quantitative Multi-Timeframe Heatmap Sniper Strategy is a comprehensive trading system integrating multiple technical indicators. Through the combination of heatmap analysis, multi-timeframe trend confirmation, and warning mechanisms, it provides traders with a reliable decision support tool. The strategy's success depends on correct parameter settings and market environment selection, and it is recommended to conduct thorough backtesting and optimization before live trading. Through continuous improvement and optimization, this strategy has the potential to maintain stable performance across various market conditions.
- 1