EMA and Candlestick Based Dynamic Price Trend Following Strategy

Overview
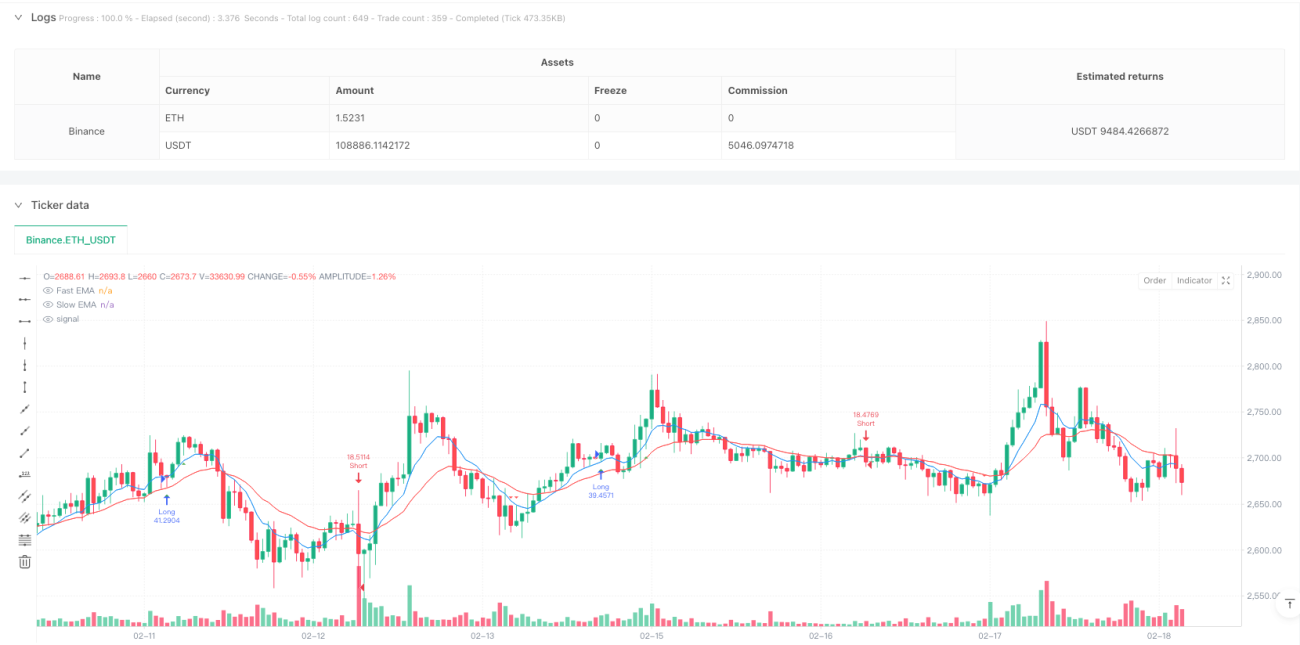
This strategy is a dynamic trend following system that combines Exponential Moving Averages (EMA) with candlestick patterns. It identifies specific candlestick patterns (Pin Bars and Engulfing Patterns), uses fast and slow EMAs to determine market trends, and employs the ATR indicator to measure market volatility. The core concept is to identify precise entry points through candlestick patterns when the market trend is confirmed.
Strategy Principles
The strategy consists of three core components:
- Candlestick Pattern Recognition System: Detects Pin Bars and Engulfing Patterns. Pin Bars require shadow length to be at least twice the body length, while Engulfing Patterns require the current candle to completely encompass the previous candle's body.
- Dynamic Trend System: Uses 8-period and 21-period EMAs to determine market trends. An uptrend is confirmed when the fast EMA is above the slow EMA; conversely for downtrends.
- Volatility Monitoring: Uses 14-period ATR to measure market volatility and provide reference for potential stop-loss settings.
Entry conditions strictly require both trend and pattern confirmation: long entries need bullish candlestick patterns during uptrends, while short entries need bearish patterns during downtrends.
Strategy Advantages
- Multiple Confirmation Mechanism: Combines trend and pattern indicators to reduce false signals.
- Dynamic Adaptability: Uses dynamic indicators like EMA and ATR to adapt to different market conditions.
- Clear Visual Feedback: Strategy marks entry signals and trend lines on the chart for intuitive market understanding.
- Structured Code Design: Strategy code is well-organized for easy maintenance and optimization.
Strategy Risks
- Lack of Stop-Loss Mechanism: Current version lacks automatic stop-loss functionality, requiring manual risk management.
- Trend Dependency: May generate frequent false signals in ranging markets.
- Lag Risk: EMAs as lagging indicators may cause slightly delayed entries.
- Over-sensitivity: Pattern recognition may be too frequent under certain market conditions.
Optimization Directions
- Implement Stop-Loss Mechanism: Suggest designing a dynamic stop-loss system based on ATR to protect profits.
- Add Filters: Can add volume confirmation or other technical indicators to reduce false signals.
- Optimize Parameters: EMA and ATR periods can be optimized for different trading instruments and timeframes.
- Add Position Management: Implement a dynamic position sizing system based on volatility.
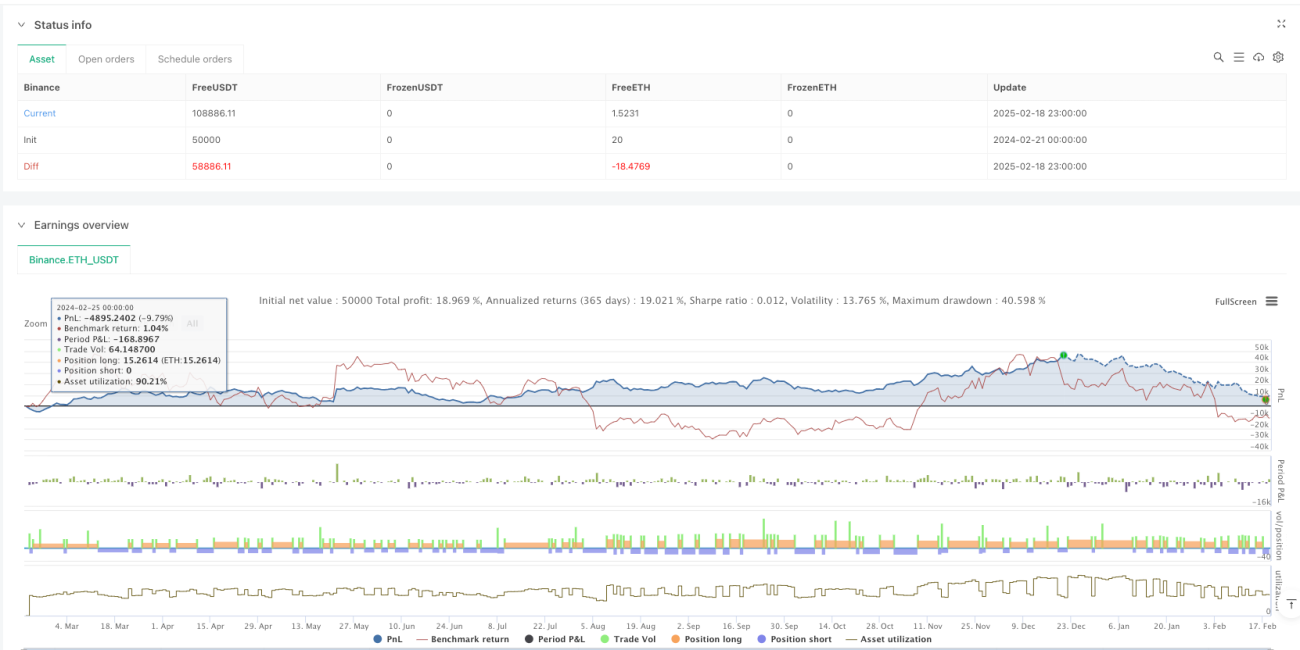
Summary
This is a well-structured trend following strategy that provides a relatively reliable trading system by combining multiple technical analysis tools. While the current version has some areas for improvement, its core logic is sound. Through implementing the suggested optimizations, this strategy has the potential to become a more comprehensive trading system. It may perform particularly well in trending markets.
/*backtest
start: 2024-02-21 00:00:00
end: 2025-02-19 00:00:00
period: 1h
basePeriod: 1h
exchanges: [{"eid":"Binance","currency":"ETH_USDT"}]
*/

//@version=6
strategy("Candlestick Bible: Dynamic Price Follower (Corrected)", overlay=true, pyramiding=0, initial_capital=10000, default_qty_type=strategy.percent_of_equity, default_qty_value=100)

//=======================- 1