
Overview
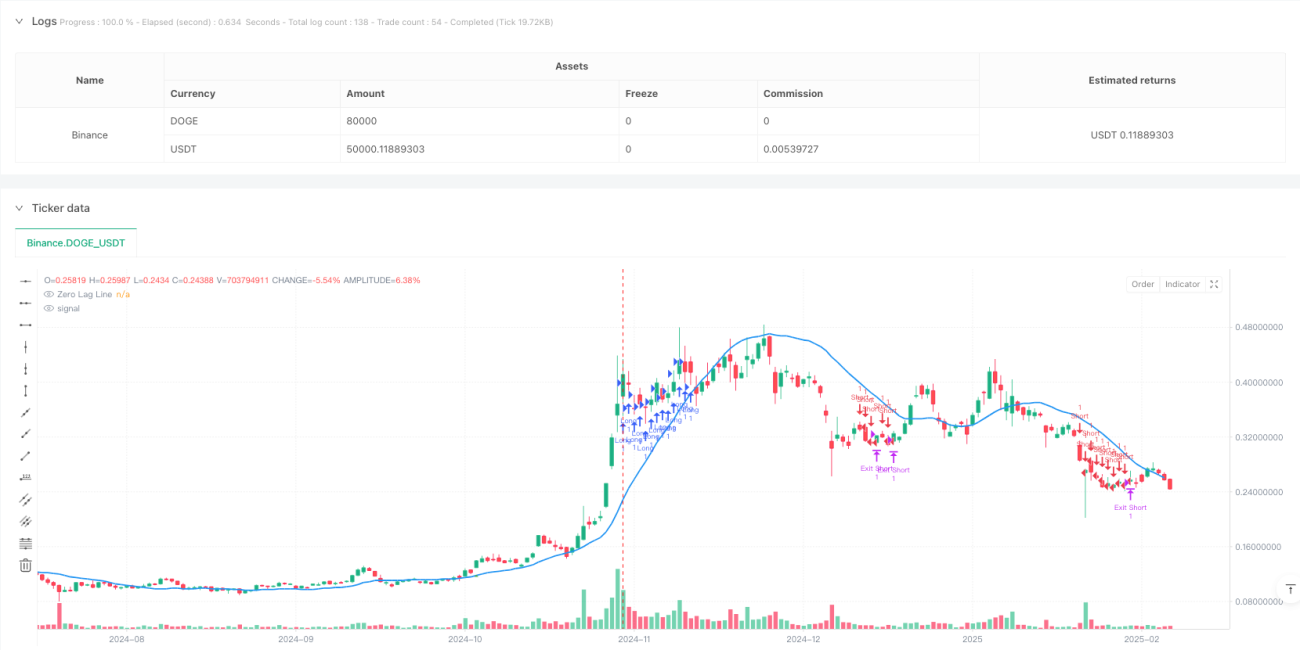
This strategy is a quantitative trading system based on zero-lag moving averages and trend strength scoring. It eliminates the lag of traditional moving averages, combining volatility channels and trend strength scoring to identify market trends and capture medium to short-term price movements. The strategy employs bi-directional trading, going long in uptrends and short in downtrends, with built-in stop-loss and take-profit mechanisms for risk control.
Strategy Principles
The core of the strategy lies in eliminating the lag effect of traditional moving averages through zero-lag calculation. This is achieved by first calculating the difference between current and lagged prices, adding this difference to the current price, and then applying moving average calculations to the result. The strategy also incorporates a trend strength scoring system that quantifies trend strength by comparing price levels across different timeframes. Additionally, it implements an ATR-based dynamic volatility channel to filter trading signals. Trade signals are only triggered when price breaks through the channel and trend score reaches the threshold.
Strategy Advantages
- Zero-lag characteristics enable faster capture of market trend changes, reducing losses associated with traditional moving average strategies.
- The trend strength scoring system provides quantitative measurement of market trends, helping filter false signals.
- Dynamic volatility channels adapt to market volatility, improving strategy stability.
- Bi-directional trading approach captures profit opportunities in both directions.
- Comprehensive stop-loss and take-profit mechanisms effectively control risk.
Strategy Risks
- May generate frequent false breakout signals in ranging markets, leading to overtrading.
- Complex parameter settings in the trend strength scoring system may require frequent adjustments under different market conditions.
- Zero-lag calculations may produce unstable results under extreme market conditions.
- Strategy relies on historical data for trend strength calculation, which may fail during severe market volatility.
Strategy Optimization Directions
- Introduce adaptive adjustment mechanism for volatility indicators (like ATR) to dynamically adjust trend strength score thresholds.
- Add volume analysis indicators to verify trend validity.
- Develop market state recognition module to use different parameter settings under different market conditions.
- Implement time filters to avoid trading during highly volatile market periods.
- Optimize stop-loss and take-profit mechanisms by dynamically adjusting ratios based on market volatility.
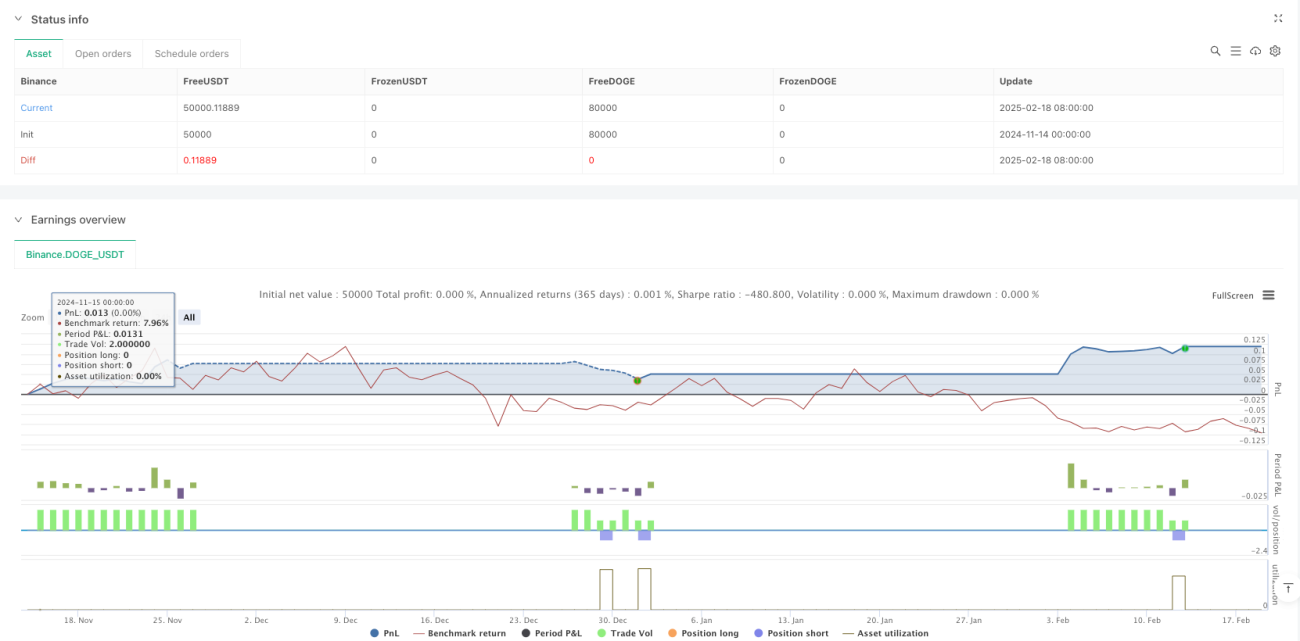
Summary
This strategy effectively addresses the lag issues in traditional trend-following strategies through innovative zero-lag calculation methods and trend strength scoring system. By incorporating dynamic volatility channels and comprehensive risk control mechanisms, it enhances strategy stability and reliability. While there is room for improvement in parameter optimization and market adaptability, the overall design is clear and shows good practical application value. Traders are advised to adjust parameters according to specific market characteristics and trading instruments when implementing the strategy in live trading.
- 1