Dynamic Liquidity Cascade Capture Strategy

Overview
This strategy is a quantitative trading system specifically designed to capture extreme market volatility periods. It monitors the deviation between price and moving averages to identify potential market liquidity exhaustion situations and capture market reversal opportunities. The strategy incorporates moving average combinations, volatility tracking, and dynamic stop-loss mechanisms to build a complete trading system.
Strategy Principles
The core of the strategy is to identify market anomalies by calculating the deviation between price and moving averages. Specific implementation includes:
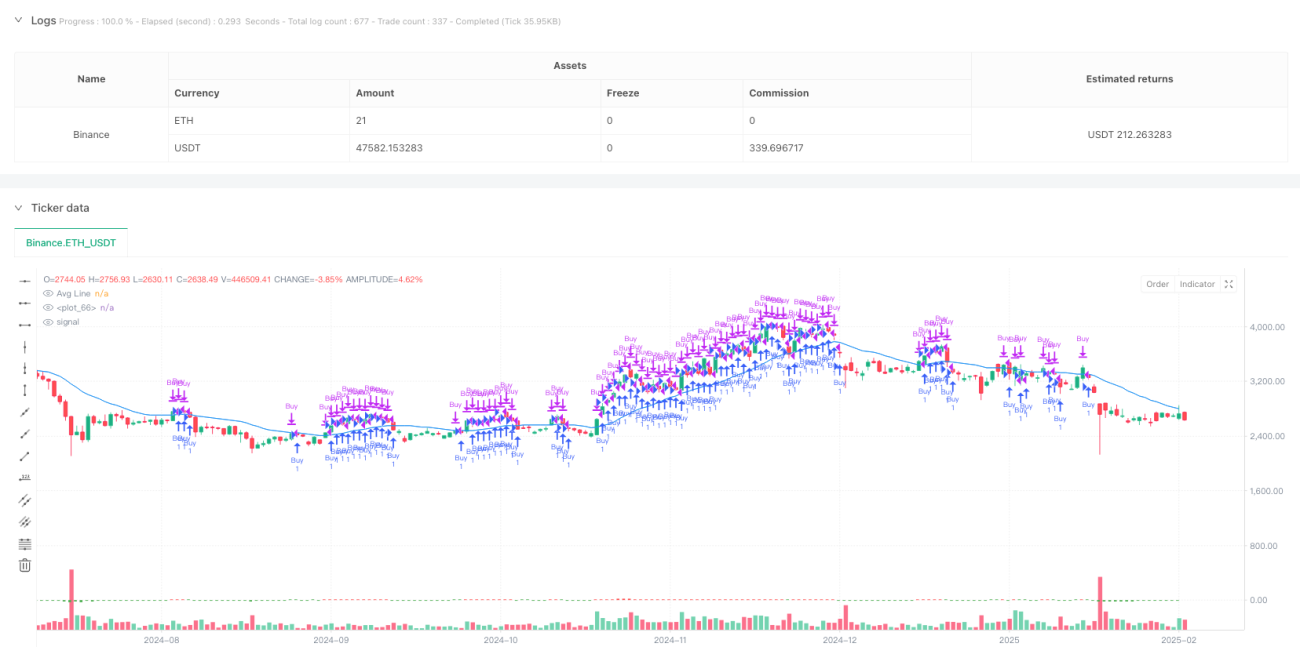
- Using a combination of 15-period Simple Moving Average (SMA) and 30-period Exponential Moving Average (EMA) as benchmark prices
- Calculating the percentage deviation between current price and moving average combination
- Determining historical extremes through 89-period highs and lows
- Entering long positions when three consecutive long-side liquidity exhaustion signals occur
- Implementing a triple exit mechanism: technical rebound, reverse liquidity exhaustion signals, and trailing stop-loss
Strategy Advantages
- Precise Market Timing: Multiple indicator confirmation improves entry accuracy
- Comprehensive Risk Control: Multi-layered stop-loss mechanism effectively controls downside risk
- High Adaptability: Strategy automatically adjusts stop-loss range based on market volatility
- Strong Execution: Clear entry and exit conditions reduce subjective judgment
- High Systematization: Entire trading process is based on quantitative indicators, easy to automate
Strategy Risks
- False Signal Risk: May generate incorrect liquidity exhaustion signals in sideways markets
- Slippage Risk: May face significant execution slippage under extreme market conditions
- Parameter Sensitivity: Strategy performance is sensitive to moving average periods and stop-loss multipliers
- Market Environment Dependency: Strategy returns may be suboptimal in low volatility environments
- Technical Risk: System stability must be maintained to avoid signal delays or losses
Strategy Optimization Directions
- Incorporate Volume Indicators: Confirm liquidity exhaustion signals through volume analysis
- Optimize Parameter Adaptivity: Dynamically adjust strategy parameters based on market volatility states
- Add Market Environment Filters: Pause trading in unsuitable market conditions
- Enhance Stop-Loss Mechanism: Consider adding volatility-based dynamic stop-loss
- Improve Signal Confirmation: Add more technical indicators to filter false signals
Summary
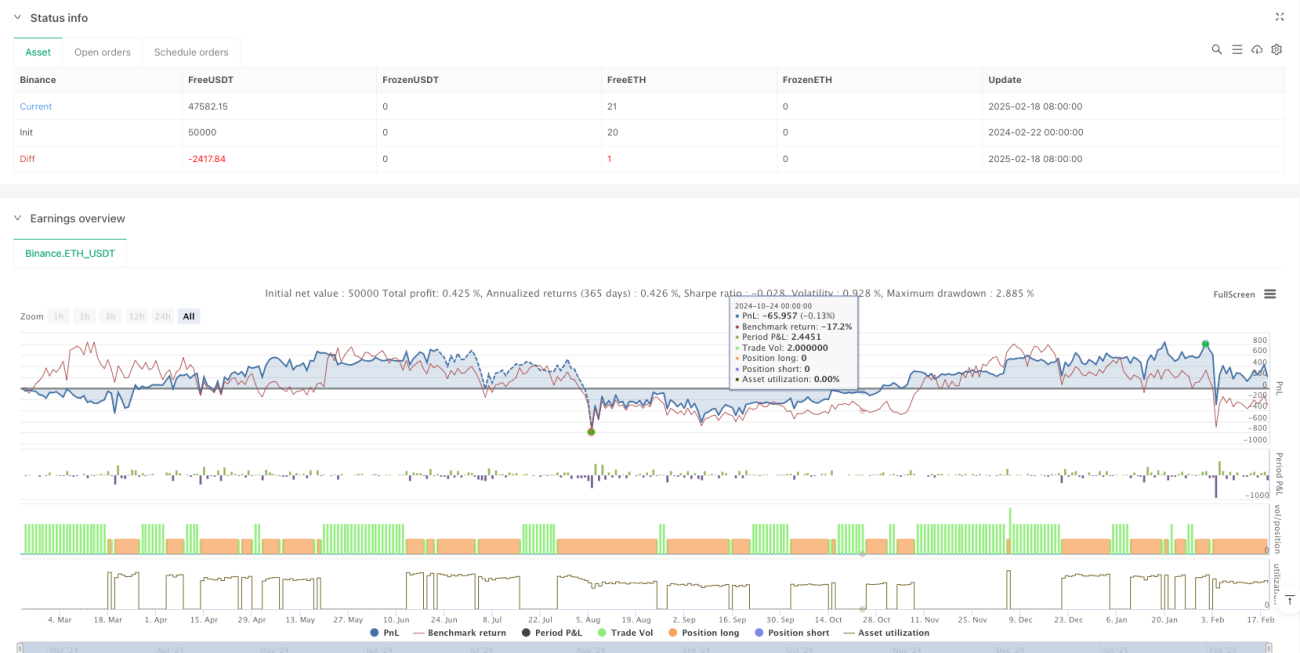
The Dynamic Liquidity Cascade Capture Strategy is a quantitative trading system focused on capturing extreme market situations. Through scientific indicator combinations and strict risk control, the strategy can capture trading opportunities during intense market volatility. While certain risks exist, through continuous optimization and improvement, the strategy has the potential to maintain stable performance across various market environments.
- 1