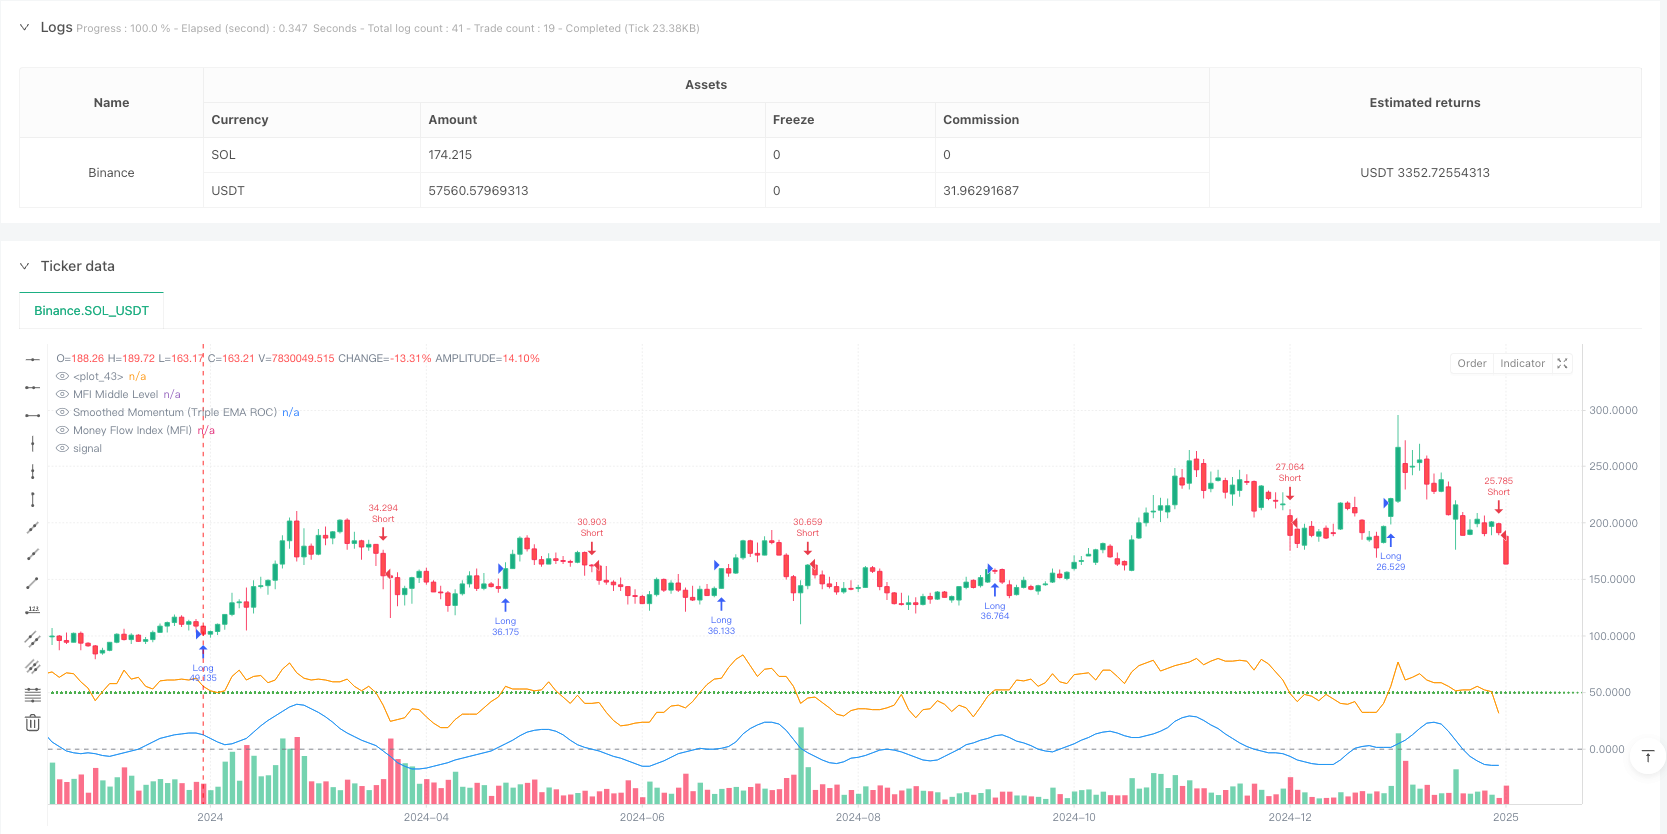
Overview
This strategy is an integrated trading system that combines momentum indicators and money flow indicators, using triple exponential moving averages (EMA) to smooth the momentum indicator, effectively reducing market noise. The strategy uses Rate of Change (ROC) to calculate raw momentum and combines it with the Money Flow Index (MFI) to confirm trading signals, applicable to various timeframes.
Strategy Principles
The core principles are based on two main technical indicators: momentum and Money Flow Index (MFI). First, ROC calculates raw momentum, which is then smoothed through triple EMA processing to obtain a more stable momentum signal line. Trading signals require simultaneous satisfaction of momentum and MFI conditions: long signals are generated when smoothed momentum is positive and MFI is above the middle level; short signals are generated when smoothed momentum is negative and MFI is below the middle level. The strategy also incorporates exit mechanisms based on momentum and MFI turning points, helping to implement timely stop-losses and lock in profits.
Strategy Advantages
- Strong Signal Smoothing: Triple EMA processing significantly reduces false signals, improving trading reliability
- Dual Confirmation Mechanism: Combines momentum and money flow dimensions, reducing limitations of single indicators
- Wide Adaptability: Applicable to different timeframes with strong universality
- Comprehensive Risk Control: Clear entry and exit conditions, including stop-loss mechanisms
- Strong Parameter Adjustability: Provides multiple adjustable parameters for optimization across different market conditions
Strategy Risks
- Trend Reversal Risk: Potential signal lag in volatile markets
- Parameter Sensitivity: Different parameter settings may lead to significant performance variations
- Market Environment Dependency: May generate frequent false signals in sideways markets
- Money Management Risk: Requires proper position sizing for risk control
- Technical Indicator Limitations: Strategy based on technical indicators may fail during fundamental changes
Strategy Optimization Directions
- Introduce Volatility Filter: Add ATR indicator to filter signals during low volatility periods
- Optimize Exit Mechanism: Add trailing stops and profit targets
- Add Time Filters: Avoid important economic data release periods
- Incorporate Volume Confirmation: Combine volume analysis to improve signal reliability
- Develop Adaptive Parameters: Dynamically adjust parameters based on market conditions
Summary
This is a well-designed trading strategy with clear logic. Through the combination of momentum and money flow indicators, along with triple EMA smoothing, it effectively balances signal timeliness and reliability. The strategy demonstrates strong practicality and scalability, suitable for further optimization and live trading application. Traders are advised to pay attention to risk control, set parameters reasonably, and optimize according to specific market conditions when implementing the strategy.
/*backtest
start: 2024-02-22 00:00:00
end: 2025-02-19 08:00:00
period: 2d
basePeriod: 2d
exchanges: [{"eid":"Binance","currency":"SOL_USDT"}]
*/

//@version=5
strategy("Momentum & Money Flow Strategy with Triple EMA Smoothing", overlay=true, initial_capital=100000, default_qty_type=strategy.percent_of_equity, default_qty_value=10)

// Input parameters
momentumPeriod  = input.int(7, title="Momentum Period", minval=1)
smoothingPeriod = input.int(3, title="Momentum Smoothing Period", minval=1)
mfiPeriod       = input.int(14, title="MFI Period", minval=1)
mfiMiddleLevel  = input.int(50, title="MFI Middle Level", minval=1, maxval=100)
mfiOverbought   = input.int(80, title="MFI Overbought Level", minval=1, maxval=100)
mfiOversold     = input.int(20, title="MFI Oversold Level", minval=1, maxval=100)

// Calculate raw momentum oscillator using rate-of-change (ROC)
rawMomentum = ta.roc(close, momentumPeriod)
// Apply triple EMA smoothing for a much smoother momentum line
smoothedMomentum = ta.ema(ta.ema(ta.ema(rawMomentum, smoothingPeriod), smoothingPeriod), smoothingPeriod)

// Calculate Money Flow Index (MFI) using the typical price (hlc3)
typicalPrice = hlc3
mfiValue     = ta.mfi(typicalPrice, mfiPeriod)

// Define conditions for filtering signals based on smoothed momentum and MFI
longCondition  = (smoothedMomentum > 0) and (mfiValue > mfiMiddleLevel)
shortCondition = (smoothedMomentum < 0) and (mfiValue < mfiMiddleLevel)

// Define exit conditions for capturing turning points
exitLongCondition  = (smoothedMomentum < 0) and (mfiValue < mfiOversold)
exitShortCondition = (smoothedMomentum > 0) and (mfiValue > mfiOverbought)

// Execute entries based on defined conditions
if (longCondition and strategy.position_size <= 0)
    strategy.entry("Long", strategy.long)
if (shortCondition and strategy.position_size >= 0)
    strategy.entry("Short", strategy.short)

// Exit positions based on turning point conditions
if (strategy.position_size > 0 and exitLongCondition)
    strategy.close("Long")
if (strategy.position_size < 0 and exitShortCondition)
    strategy.close("Short")

// Plot the triple EMA smoothed momentum oscillator and MFI for visual reference
plot(smoothedMomentum, title="Smoothed Momentum (Triple EMA ROC)", color=color.blue)
hline(0, color=color.gray)
plot(mfiValue, title="Money Flow Index (MFI)", color=color.orange)
hline(mfiMiddleLevel, color=color.green, linestyle=hline.style_dotted, title="MFI Middle Level")