
Overview
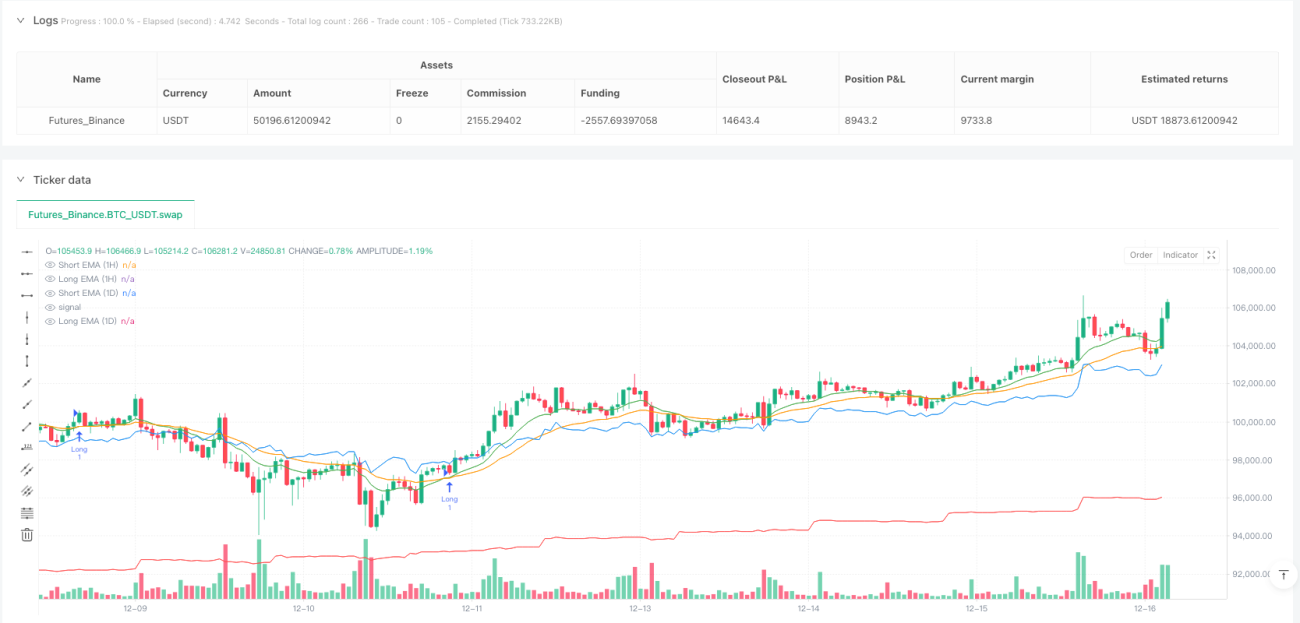
The Dual Timeframe EMA Trend Recognition and Trading Trigger Quantitative Strategy is a trend-following trading system that combines two time periods: daily and hourly charts. This strategy primarily utilizes Exponential Moving Averages (EMAs) on different timeframes to identify overall market trend direction and generate precise trading signals. The core concept of the strategy design is "trend following" - using a longer timeframe (daily) to determine the overall trend direction, while utilizing a shorter timeframe (hourly) to find optimal entry points, complemented by volatility filtering and fixed stop-loss mechanisms to ensure risk control.
Strategy Principles
The core principles of this strategy are based on multi-timeframe analysis and EMA crossover signals. The specific working mechanism is as follows:
-
Trend Identification (Daily Level):
- Uses the relative position of 5-period short-term EMA and 30-period long-term EMA on the daily timeframe to determine overall trend
- When short-term EMA(5) is above long-term EMA(30), an uptrend is confirmed
- When short-term EMA(5) is below long-term EMA(30), a downtrend is confirmed
-
Trade Signal Generation (Hourly Level):
- On the hourly timeframe, uses crossovers between 12-period short-term EMA and 26-period long-term EMA to generate trading signals
- Buy Signal: When hourly short-term EMA crosses above long-term EMA AND daily trend is up
- Sell Signal: When hourly short-term EMA crosses below long-term EMA AND daily trend is down
-
Volatility Trigger Mechanism:
- Additional trade triggers based on price volatility are set up
- High Volatility Uptrend: If price rises more than 5% within a single candle and daily trend is up, triggers a long signal
- High Volatility Downtrend: If price falls more than 5% within a single candle and daily trend is down, triggers a short signal
-
Stop Loss Calculation:
- Long Trades: Stop loss set at the lowest point of the past 10 candles
- Short Trades: Stop loss set at the highest point of the past 10 candles
-
Trade Execution:
- Enter long position when buy signal or high volatility uptrend conditions are met
- Enter short position when sell signal or high volatility downtrend conditions are met
- Exit trades according to calculated stop-loss levels
In the core code implementation, the strategy uses the request.security function to obtain EMA values from different timeframes, then utilizes the crossover detection functions ta.crossover and ta.crossunder to detect EMA crossovers. By combining daily trends with hourly signals, counter-trend trades are effectively filtered out, improving trade quality.
Strategy Advantages
After in-depth analysis of the strategy code, this quantitative trading system has the following significant advantages:
-
Multi-Timeframe Analysis: Combines daily and hourly timeframes, capable of both capturing the major trend direction and precisely timing entries, effectively balancing trading frequency and success rate.
-
Trend Confirmation Mechanism: By requiring hourly trading signals to align with the daily trend direction, counter-trend trades are effectively filtered out, reducing false signals.
-
Multi-dimensional Trigger Conditions: In addition to conventional EMA crossover signals, a volatility-based trigger mechanism is added, capable of capturing sudden strong price movements, enhancing strategy adaptability.
-
Dynamic Stop-Loss Setting: Stop-loss points automatically adjust based on recent market volatility (highest/lowest points of the past 10 candles), providing targeted risk control for different market conditions.
-
Bi-directional Trading Capability: Supports both long and short trading, generating profit opportunities in different market environments.
-
Visual Feedback: The strategy provides four differently colored EMA lines on the chart, allowing traders to intuitively judge current market conditions and strategy signals.
-
Simple and Clear Parameters: Uses only four main parameters (two EMA lengths for each of two timeframes), reducing the risk of overfitting while facilitating optimization and adjustment.
Strategy Risks
Despite its sophisticated design, this strategy still has the following potential risks:
-
Poor Performance in Oscillating Markets: As a trend-following strategy, it may generate numerous false signals in sideways or frequently oscillating market environments, leading to consecutive stop-losses.
- Solution: Consider adding supplementary sideways market identification indicators (such as ADX or volatility indicators), and pause trading when sideways markets are identified.
-
Limitations of Fixed Volatility Trigger Threshold: The fixed 5% volatility threshold may be too high or too low for different instruments or market environments.
- Solution: Consider making the volatility threshold dynamic, such as based on multiples of ATR (Average True Range) or percentages of historical volatility.
-
Stop-Loss Settings May Be Too Loose: Using extremes from the past 10 candles as stop-losses may in some cases result in stop-loss points that are too distant, increasing per-trade risk.
- Solution: Introduce ATR-based stop-loss mechanisms, or implement a hybrid strategy combining fixed percentage stops with dynamic stops.
-
Fixed EMA Parameters: The EMA parameters used in the strategy are fixed, which may not be suitable for all market environments.
- Solution: Consider implementing parameter adaptive mechanisms to automatically adjust EMA lengths based on market volatility.
-
Lack of Profit-Taking Mechanism: The strategy defines clear entry and stop-loss conditions, but lacks profit-taking mechanisms, potentially leading to profit giveback.
- Solution: Add trailing stops or technical indicator-based profit-taking conditions, such as price breaking through another moving average or reaching a certain profit percentage.
Optimization Directions
Based on strategy analysis, here are several feasible optimization directions:
-
Add Trend Strength Filtering:
- Introduce ADX (Average Directional Index) to measure trend strength, only executing trades when ADX values exceed a specific threshold
- This can filter out weak trend signals in oscillating markets, reducing losses from false breakouts
-
Dynamic Volatility Threshold:
- Change the fixed 5% volatility trigger threshold to an ATR-based dynamic threshold, such as 1.5x or 2x the current ATR value
- This better adapts to different market environments and volatility characteristics of different instruments
-
Improve Stop-Loss Mechanism:
- Introduce trailing stop functionality that automatically adjusts stop-loss positions as price moves favorably
- Consider using trailing stops or support/resistance-based intelligent stops
-
Add Profit-Taking Conditions:
- Set target price levels based on risk-reward ratios (such as 1:2 or 1:3)
- Implement partial position management, allowing gradual closing of positions at different price levels
-
Add Volume Confirmation:
- Add volume confirmation conditions when generating trade signals, requiring synchronized increases in volume
- This helps verify the validity of price breakouts, reducing losses from false breakouts
-
Parameter Optimization and Adaptation:
- Implement adaptive adjustment mechanisms for EMA parameters, dynamically adjusting EMA lengths based on market volatility conditions
- Consider using machine learning methods to find optimal parameter combinations for different market environments
-
Add Market Environment Classification:
- Introduce market environment classification functionality, categorizing markets into trending, oscillating, etc.
- Adopt different trading parameters or trading logic based on different market environments
Implementation of these optimization directions will help improve the strategy's robustness and adaptability, enabling it to maintain good performance across more market environments.
Summary
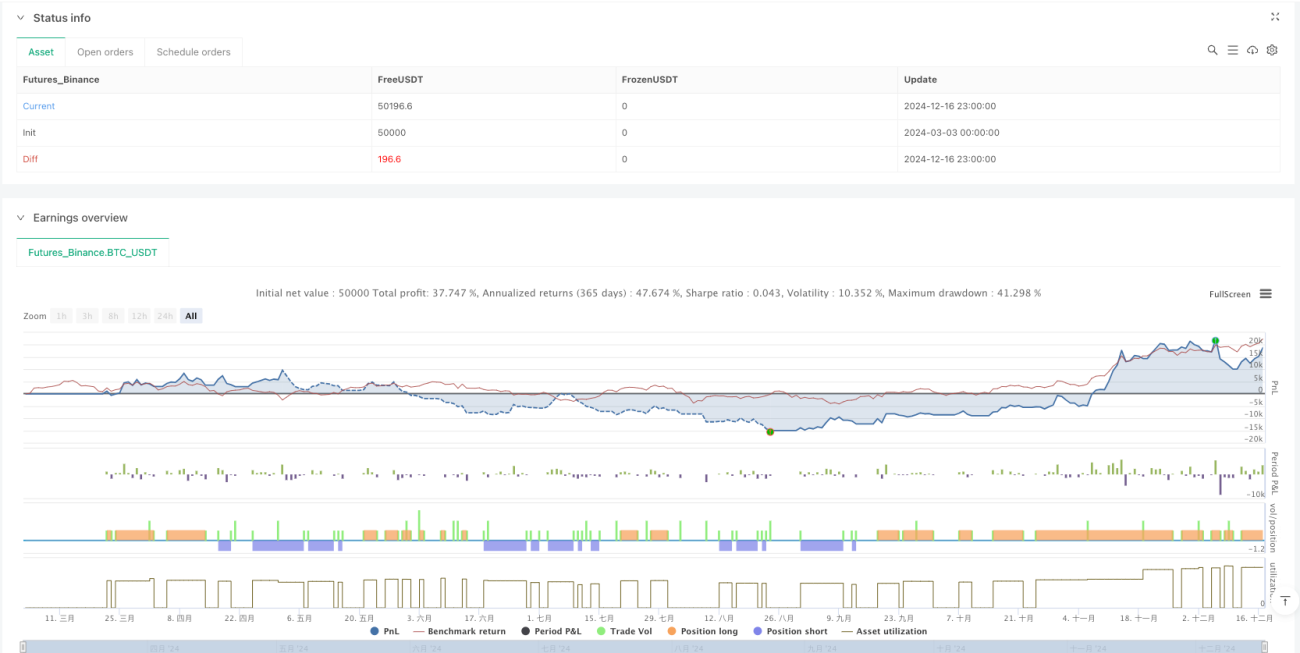
The Dual Timeframe EMA Trend Recognition and Trading Trigger Quantitative Strategy is a comprehensive trading system combining trend-following and momentum trading concepts. By using daily EMAs to determine overall trend direction and hourly EMAs to generate precise entry signals, while incorporating volatility trigger conditions and dynamic stop-loss mechanisms, it constructs a relatively complete trading framework.
The strategy's main advantages lie in its multi-timeframe analysis capability and trend confirmation mechanism, effectively filtering out counter-trend trades and reducing false signals. Meanwhile, its simple parameter design and bi-directional trading capability give it strong practicality and adaptability.
However, the strategy may underperform in oscillating markets, and its fixed volatility threshold and stop-loss mechanisms have room for optimization. Through adding trend strength filtering, dynamic volatility thresholds, improved stop-loss mechanisms, and market environment classification, strategy performance can be further enhanced.
For traders seeking to combine major trends with precise entries, this is a foundational strategy framework worth considering, which can be further customized and optimized according to personal trading style and market characteristics.
- 1