Multi-EMA Crossover Momentum Alert Trading Strategy

Overview
This is a trading strategy based on multiple Exponential Moving Averages (EMAs), combining trend following, momentum confirmation, and volatility alert systems. The strategy primarily utilizes 5, 10, 15, 20, 50, and 200-day EMA crossover signals to determine market direction, while incorporating an intelligent cooldown period and risk warning mechanism to help traders open and close positions at appropriate times. The strategy categorizes trading opportunities into Call and Put scenarios, applied in uptrends and downtrends respectively, optimizing trade entry and exit timing through multiple filtering conditions.
Strategy Principles
The core logic of this strategy is built on multiple EMA crossovers and trend confirmation:
-
Trend Determination Mechanism: Market trends are identified by the relative position of the 10-day EMA to the 20-day EMA, as well as the relationship between closing price and the 50-day EMA. When the 10-day EMA is above the 20-day EMA and the closing price is above the 50-day EMA, an uptrend is established; otherwise, it's considered a downtrend.
-
Momentum Confirmation: The strategy incorporates the 5-day EMA as a short-term momentum indicator. For bullish signals, it requires the 5-day EMA to be higher than the previous period and above the 10-day EMA; for bearish signals, it requires the 5-day EMA to be lower than the previous period and below the 10-day EMA, ensuring trade direction aligns with short-term momentum.
-
Intelligent Entry and Exit Rules:
- Call Signals: Open positions when uptrend is confirmed and short-term momentum is rising; close positions when price falls below the 15-day EMA.
- Put Signals: Open positions when downtrend is confirmed and short-term momentum is falling; close positions when price rises above the 15-day EMA.
-
Cooldown Period Mechanism: The strategy features a flexible cooldown period setting, defaulting to 2 periods, preventing frequent trading caused by immediate re-entry after closing positions. Users can adjust this parameter based on market characteristics.
-
Risk Warning System: By calculating the rate of change in percentage differences between the 5-day and 10-day EMAs, the system triggers a warning signal when the latest rate of change exceeds 2.5 times the average of the previous 5 periods and the current difference is smaller than the previous period. This alerts to potential abnormal market volatility and can optionally trigger automatic position closure to mitigate risk.
Strategy Advantages
-
Multi-level Trend Confirmation: Through multi-period EMA crossover verification, the strategy reduces false breakout signals, enhancing trading reliability. It combines short-term (5, 10-day), medium-term (15, 20-day), and long-term (50, 200-day) moving averages to comprehensively assess market trend conditions.
-
Dynamic Adaptability: The strategy automatically switches trading direction according to changing market trends, seeking bullish opportunities in rising markets and bearish opportunities in falling markets, demonstrating good market adaptability.
-
Comprehensive Risk Management: The warning system can detect abnormal market volatility, promptly issue alerts, and optionally close positions automatically, effectively controlling drawdown risk. The cooldown mechanism prevents overtrading, reducing transaction costs and the risk of emotional trading.
-
Parameter Customizability: The strategy offers rich parameter setting options, allowing users to adjust key parameters such as EMA periods, cooldown length, and warning sensitivity based on different market environments and personal risk preferences.
-
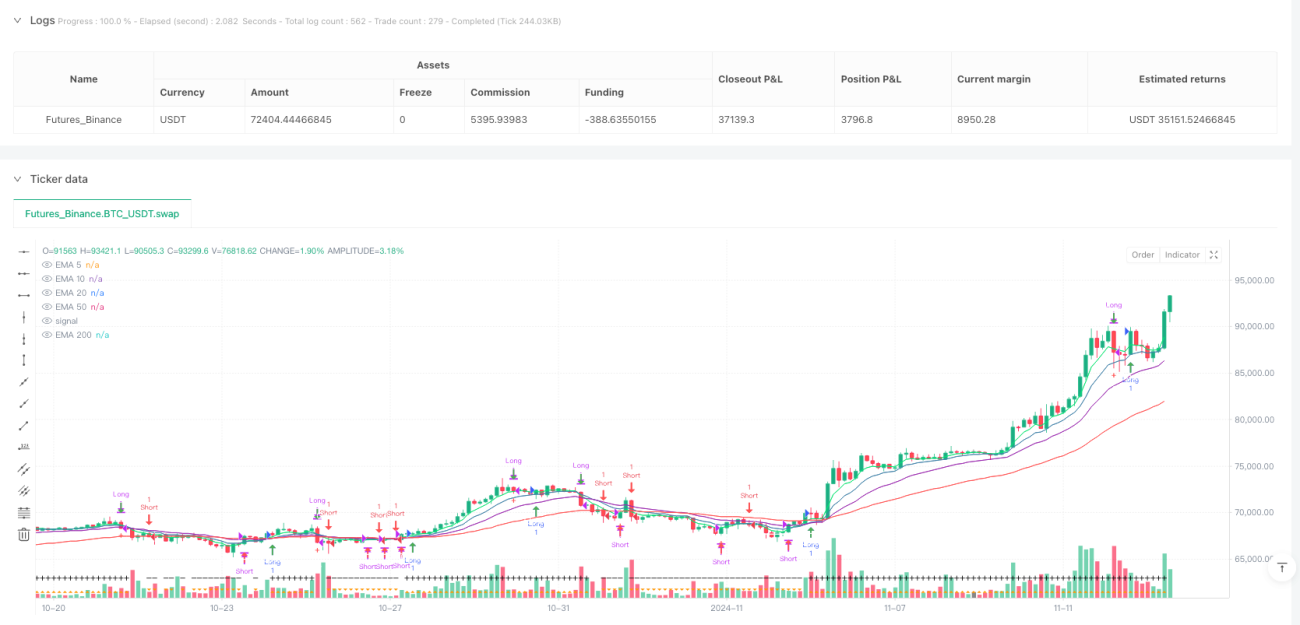
Visualized Trading Signals: The strategy clearly marks trading signals through shapes and colors, with green arrows for bullish signals, red arrows for bearish signals, and bottom triangles indicating current trend direction, making trading decisions intuitive and clear.
Strategy Risks
-
Moving Average Lag: Moving averages are inherently lagging indicators and may cause delayed entry and exit signals in oscillating markets or rapid reversal markets, resulting in potential losses. To mitigate this risk, consider introducing leading indicators as supplementary confirmation.
-
False Breakout Risk: Despite using multiple moving average crossovers and momentum confirmation to reduce false signals, frequent crossovers during market consolidation phases may still generate erroneous signals. Caution is advised when using this strategy in low-volatility market environments, or parameter adjustments may be necessary.
-
Severe Volatility Risk: During significant market fluctuations, the warning system may not respond promptly to sudden price movements. Consider adding volatility indicators such as ATR (Average True Range) and setting dynamic stop losses to provide additional protection.
-
Parameter Optimization Trap: Excessive parameter optimization may result in a strategy that performs excellently on historical data but fails in future markets. Step-wise optimization and out-of-sample testing are recommended to verify parameter robustness.
-
Long-term Trend Reversal Risk: The strategy may generate consecutive loss signals during the initial phase of long-term trend changes. Consider increasing the weight of long-term trend indicators such as the 200-day EMA, or reducing position size when trends are unclear.
Strategy Optimization Directions
-
Adaptive Parameter Adjustment: The current strategy uses fixed EMA periods. An adaptive mechanism could be introduced to dynamically adjust EMA period lengths based on market volatility. For example, using longer EMA periods in high-volatility markets to reduce noise, and shorter EMA periods in low-volatility markets to increase sensitivity.
-
Multi-timeframe Analysis: Adding trend confirmation from higher timeframes and trading only in the direction of the main trend can significantly improve win rates. For instance, only taking long positions when both daily and 4-hour charts show uptrends.
-
Stop Loss Optimization: The current strategy's exit condition is relatively simple (15-day EMA). Dynamic stop-loss mechanisms could be introduced, such as volatility-based stops using ATR or trailing stops, to limit maximum loss per trade while preserving profits.
-
Money Management Integration: Adding position sizing based on risk, dynamically determining the proportion of capital for each trade according to market volatility and signal strength, thereby optimizing overall risk-reward ratio.
-
Sentiment Indicator Supplement: Combining volume, Volume Weighted Average Price (VWAP), or market breadth indicators can enhance the reliability of trend confirmation. Especially near important support and resistance levels, market sentiment indicators can provide additional confirmation.
-
Machine Learning Optimization: Using machine learning techniques to classify and filter signals, identifying characteristics of high-probability trading environments and avoiding trading in unfavorable market conditions can significantly improve overall strategy performance.
Summary
The Multi-EMA Crossover Momentum Alert Trading Strategy is a well-structured quantitative trading system that creates a comprehensive trading decision framework through multi-level EMA crossover signals, momentum confirmation, cooldown mechanisms, and a risk warning system. The strategy performs excellently in trending markets while possessing defensive mechanisms to handle abnormal market volatility.
The main advantages of this strategy lie in its comprehensive trend determination mechanism and well-developed risk control system, enabling it to maintain stable performance across different market environments. However, as a moving average-based trading system, the strategy still faces inherent risks such as lag and false breakouts.
Future optimizations can focus on parameter adaptivity, multi-timeframe analysis, dynamic stop losses, and risk management to further enhance the strategy's robustness and adaptability. By introducing machine learning techniques and market sentiment indicators, a qualitative leap in strategy performance can be achieved, maintaining its competitiveness across various market conditions.
/*backtest
start: 2024-03-24 00:00:00
end: 2024-11-14 00:00:00
period: 3h
basePeriod: 3h
exchanges: [{"eid":"Futures_Binance","currency":"BTC_USDT"}]
*/

//@version=6
strategy(title='GRIM309 CallPut Strategy', shorttitle='CallsPuts Strategy', overlay=true, initial_capital=500, commission_value=0.1)

// Input parameters for EMAs- 1