
Overview
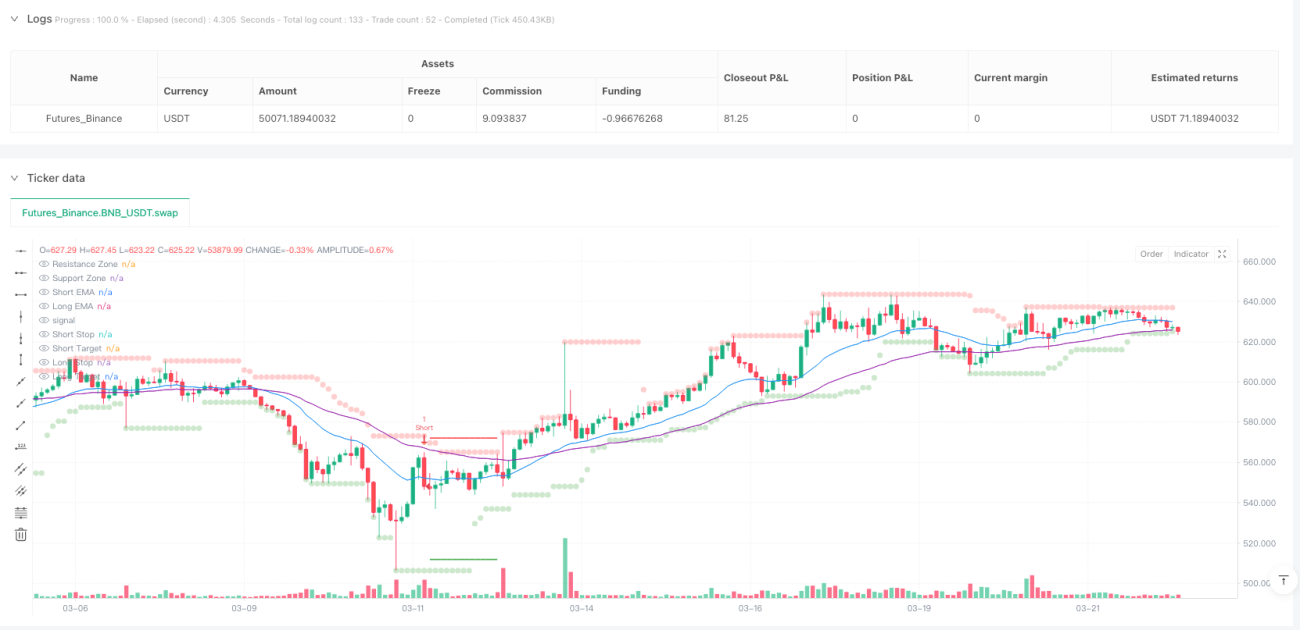
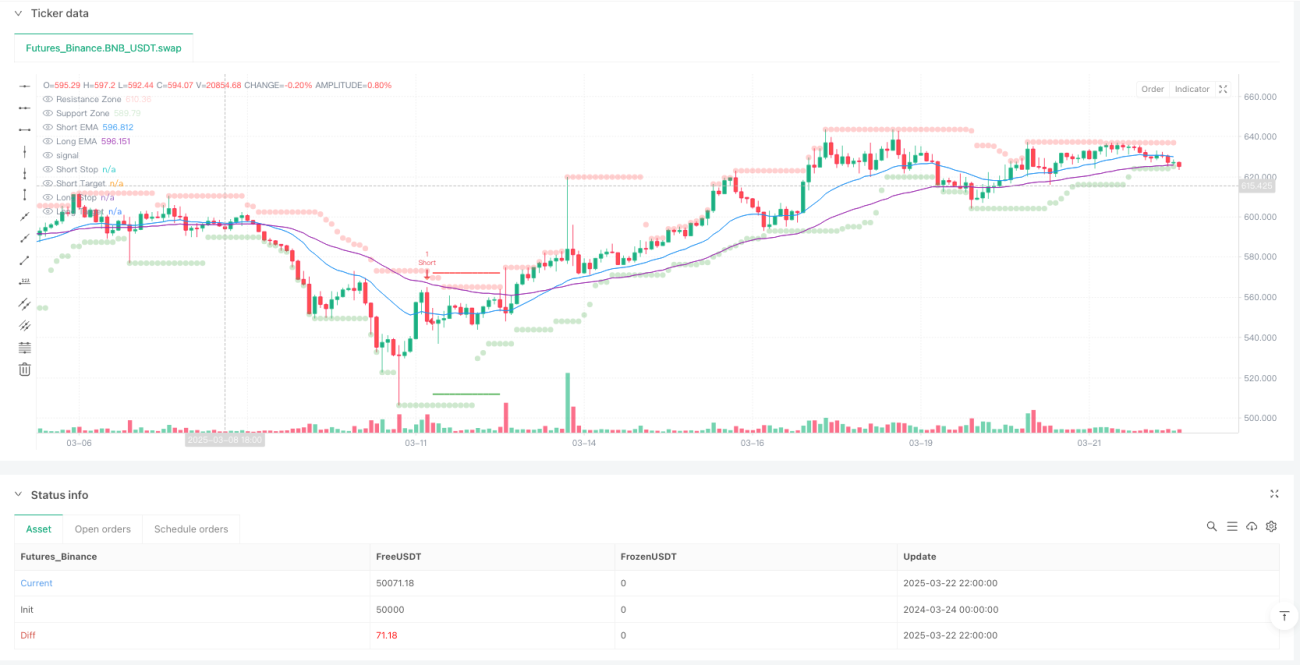
The Multi-Factor Trend-Price Action Strategy with Dynamic Risk Management System is a quantitative trading strategy that combines multiple analytical elements, integrating trend identification, price action patterns, volume confirmation, and volatility management to generate high-probability trading signals. This strategy employs a dual Exponential Moving Average (EMA) crossover system, Average Directional Index (ADX) filtering, support/resistance identification, Fair Value Gap (FVG) detection, and adaptive Average True Range (ATR) stop-loss and take-profit mechanisms to form a comprehensive trading decision framework.
The core advantage lies in its tiered signal system, which distinguishes between strong and weak signals, allowing traders to adjust position sizing based on signal strength. Through a comprehensive assessment of trend direction, price patterns, volume confirmation, and market volatility, this strategy provides systematic trading rules while maintaining flexibility.
Strategy Principles
The strategy operates through four main components working in harmony: trend identification, price action signals, volume validation, and risk management.
-
Trend Identification System:
- Uses short-term EMA (default 20-period) and long-term EMA (default 50-period) crossovers to determine trend direction
- Employs ADX indicator (default 14-period) to filter non-trending markets, requiring ADX values above 20
- Confirms uptrend when short-term EMA is above long-term EMA, and downtrend in the opposite scenario
-
Price Action Signals:
- Detects engulfing patterns (bullish/bearish) as potential reversal signals
- Identifies hammer/inverted hammer formations and validates alignment with trend direction
- Tracks Fair Value Gaps (FVGs) and monitors their fill status, with a fill window set to 5 bars
-
Volume Validation:
- Requires current volume to exceed 1.5 times the volume moving average
- Previous bar's volume must exceed 1.2 times its moving average
- Combines volume spikes with price action to confirm signal validity
-
Risk Management Mechanism:
- Uses 14-period ATR to calculate dynamic stop-loss and take-profit levels
- Sets stop-loss distance at 2 times the ATR value
- Sets take-profit distance at 3 times the ATR value, establishing a 1:1.5 risk-reward ratio
The core of the strategy lies in its signal priority system: strong signals require all conditions (FVG + engulfing pattern + volume + trend) to be met simultaneously, while weak signals only need pattern + volume + support/resistance break. This tiered approach ensures maximum position sizing only in highest confidence scenarios.
Strategy Advantages
-
Multi-Factor Confirmation Mechanism:
- Significantly reduces false signals by requiring multiple technical indicators to confirm simultaneously
- Enhances signal quality through comprehensive analysis of trend, pattern, volume, and volatility
- Tiered signal system allows flexible position sizing based on confirmation strength
-
Adaptive Risk Management:
- ATR-based dynamic stop-loss and take-profit automatically adjust to actual market volatility
- Differentiated risk management under various market conditions (strong/weak signals use different thresholds)
- Preset risk-reward ratio ensures long-term stability
-
Anti-Repainting Support/Resistance:
- Calculates support/resistance zones using confirmed historical pivot points, avoiding common repainting issues
- Visualization of support/resistance zones makes decision-making more intuitive
-
Adaptive Fair Value Gap Tracking:
- Intelligently detects price gaps and monitors their fill status
- 5-bar gap fill expiration mechanism prevents outdated signals from interfering
-
High Customizability:
- Provides multiple user-adjustable parameters to adapt to different markets and timeframes
- Modular design allows independent optimization of individual components (trend, support/resistance, FVG, volume)
-
Visual Decision Support:
- Signals use different colors and sizes to differentiate strength
- Real-time display of stop-loss and take-profit levels enhances risk awareness
Strategy Risks
-
Parameter Sensitivity:
- Multiple parameter settings increase the risk of overfitting
- Different market conditions may require frequent parameter adjustments
- Solution: Establish parameter presets for various market types and conduct comprehensive backtest validation
-
Limitations of Multi-Condition Filtering:
- Strict multi-condition screening may reduce trading opportunities
- High-standard entries might miss some valid but imperfect trading chances
- Solution: Consider adding medium-strength signal categories or adjusting condition strictness based on market volatility
-
Moving Average Lag:
- EMA crossover systems have inherent lag, potentially missing early stages of trends
- Solution: Incorporate price action and support/resistance breakouts to identify potential trend changes earlier
-
Issues with Fixed ATR Multipliers:
- Fixed ATR multipliers may not be flexible enough in extremely volatile markets
- Solution: Implement adaptive multiplier systems that dynamically adjust based on market volatility
-
Volume Dependency Limitations:
- Volume data may be unreliable or less meaningful in certain markets or time periods
- Solution: Provide optional non-volume alternative validation methods, such as RSI or MACD confirmation
-
Lack of Market State Adaptability:
- Current strategy performs excellently in trending markets but may underperform in range-bound markets
- Solution: Add market state detection module to use different trading rules in range-bound markets
Strategy Optimization Directions
-
Market State Adaptive System:
- Implement a mechanism to automatically detect different market states (trending, range-bound, high volatility)
- Dynamically adjust strategy parameters and signal thresholds based on detected market state
- This will significantly enhance strategy stability across different market environments
-
Multiple Timeframe Integration:
- Add higher timeframe trend filtering functionality
- Implement consistency checks between lower timeframe entries and higher timeframe trend direction
- This helps avoid trading against major trends, improving overall win rate
-
Dynamic Stop-Loss Management:
- Implement trailing stop functionality to lock in profits during trend development
- Automatically adjust ATR multipliers based on market volatility and price action
- This can maximize returns in favorable market conditions while protecting capital
-
Re-Entry Mechanism Optimization:
- Develop intelligent re-entry algorithms to allow position additions in strong trends
- Design gradient position management systems to adjust position size based on signal strength and market confirmation
- This will improve capital utilization efficiency in strong trending markets
-
Machine Learning Enhancement:
- Integrate simple machine learning algorithms to dynamically optimize parameter combinations
- Use historical data to train models to identify optimal parameter settings
- This will reduce manual intervention and improve the strategy's adaptive capabilities
-
Sentiment Indicator Integration:
- Add market sentiment indicators (such as VIX or Fear & Greed Index) as additional filters
- Adjust signal thresholds under extreme market sentiment conditions
- This helps avoid false signals during extreme market conditions
Summary
The Multi-Factor Trend-Price Action Strategy with Dynamic Risk Management System represents a comprehensive technical analysis trading approach that provides high-probability trading opportunities by integrating multiple market analysis techniques. The core strengths of this strategy lie in its rigorous multi-factor confirmation mechanism, adaptive risk management system, and tiered signal priority framework.
By combining trend identification (EMA crossovers and ADX filtering), price action analysis (engulfing patterns and FVGs), volume confirmation, and dynamic ATR risk management, the strategy offers sufficient flexibility while maintaining a systematic approach. Its modular design allows traders to adjust based on different market environments and personal risk preferences.
Though the strategy features multiple validation mechanisms to reduce false signals, risks from potential overfitting due to the multi-parameter system and reduced trading opportunities due to strict conditions should be noted. Future optimization directions should focus on market state adaptability, multiple timeframe integration, and dynamic risk management functions to further enhance the strategy's performance across different market environments.
Overall, this strategy provides a structured trading framework that balances multiple dimensions of technical analysis to pursue consistent returns while maintaining reasonable risk. For traders who understand technical analysis and seek systematic trading methods, this represents a valuable strategy template worth considering.
- 1