EMA 20 Breakout Trend Following Quantitative Trading Strategy

Overview
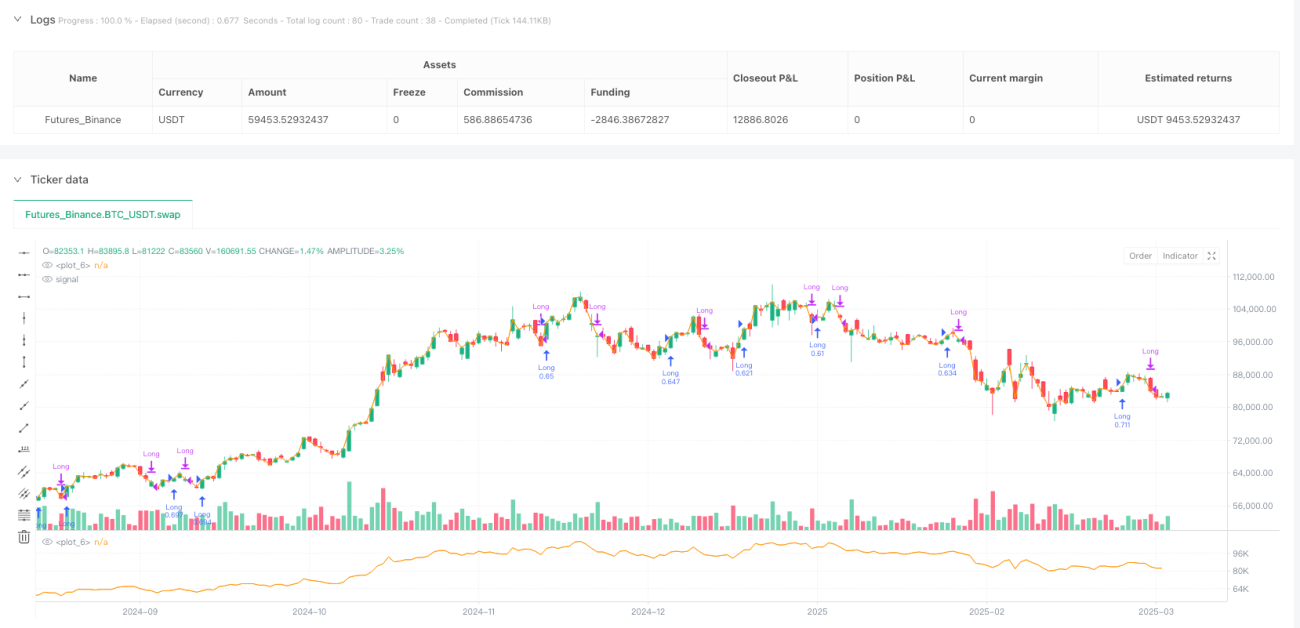
This strategy is a trend following trading system based on the 20-day Exponential Moving Average (EMA). The core concept is to capture bullish trend opportunities when price breaks above the 20-day EMA and exit positions when price falls below the moving average. It represents a classic technical analysis trend following approach. The strategy is simple and intuitive, suitable for trend-oriented assets that tend to run above the 20 EMA on the daily timeframe, effectively capturing medium to long-term uptrends.
Strategy Principle
The core principle of this strategy is based on moving average theory in technical analysis, with the following implementation logic:
- Calculate the 20-day Exponential Moving Average (EMA) as the key technical reference line.
- Entry signal: When price crosses above the 20-day EMA, the system generates a long entry signal (detected by the ta.crossover function).
- Exit signal: When price crosses below the 20-day EMA, the system generates a position closing signal (detected by the ta.crossunder function).
- Position management: Each trade uses 100% of the account equity.
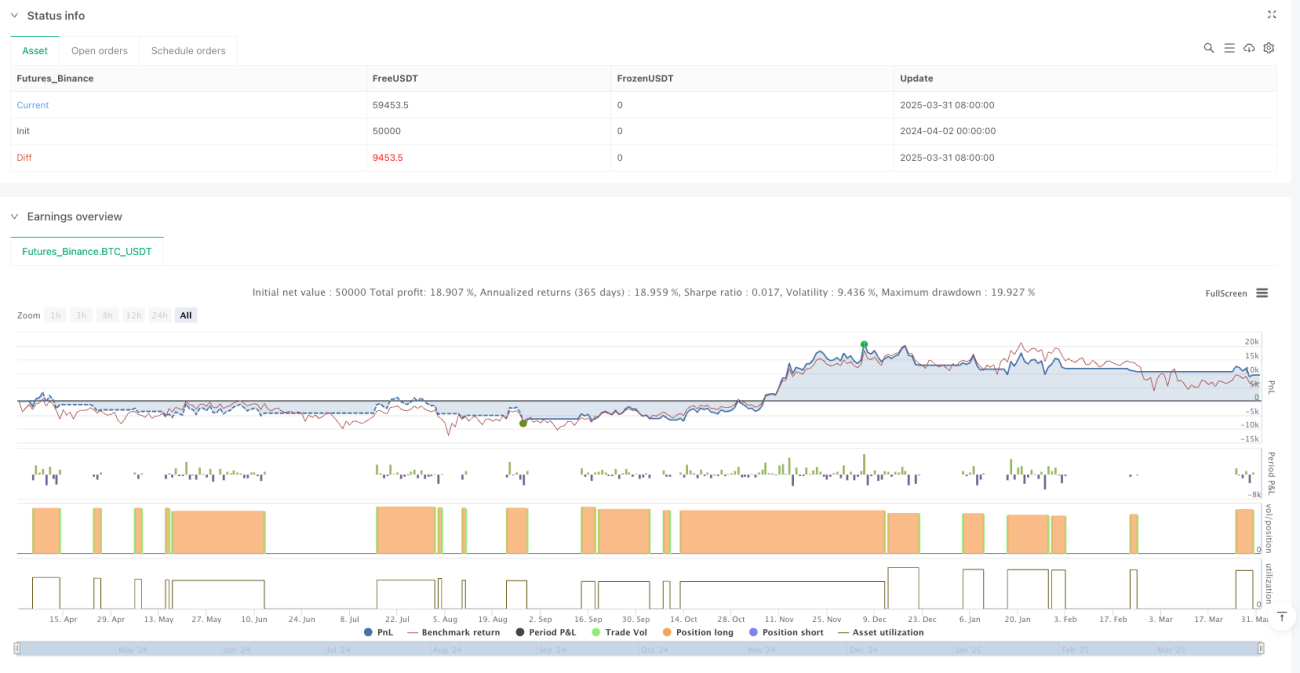
- The strategy also tracks win rate statistics, displaying the win rate and total number of trades on the chart in real-time.
From the implementation perspective, the strategy is written in Pine Script language and backtested through TradingView's strategy module. Entry conditions (longCondition) and exit conditions (exitCondition) are clearly defined, with straightforward trade execution. The strategy also includes win rate calculation logic, determining whether a trade is profitable by comparing whether the net profit at position close is positive, and dynamically displaying win rate data on the chart.
Strategy Advantages
-
Simplicity: The strategy logic is clear without complex indicator combinations, making it easy to understand and execute, reducing the psychological burden on traders.
-
Trend Capturing Ability: The 20-day EMA is an effective indicator for medium-term trends, filtering out short-term market noise and effectively capturing the main trend direction.
-
Automated Trading: The strategy rules are explicit and can be fully automated, eliminating emotional interference.
-
High Adaptability: This strategy is applicable to various trending assets, especially those with significant trend characteristics on the daily timeframe.
-
Performance Tracking: Built-in win rate statistics function allows real-time understanding of strategy performance, helping traders objectively evaluate strategy effectiveness.
-
Clear Risk Management: With explicit exit conditions, the strategy can promptly cut losses when trends reverse, avoiding significant drawdowns.
-
Capital Efficiency: The strategy uses full position sizing after confirming a trend, fully leveraging capital efficiency in strong trending markets.
Strategy Risks
-
Poor Performance in Ranging Markets: In sideways, choppy markets, prices frequently crossing the 20-day EMA will lead to frequent trades and whipsaws, resulting in consecutive small losses.
-
Lag Issues: As a lagging indicator, EMA has a certain delay at trend turning points, potentially leading to late entries or exits, missing optimal price points.
-
Lack of Risk Control Parameters: The current strategy doesn't set stop-loss and take-profit parameters, potentially facing significant drawdown risk in extreme market conditions.
-
Aggressive Capital Management: The strategy defaults to using 100% of funds for trading without adjusting position size based on volatility, bearing higher risk.
-
Over-reliance on a Single Indicator: Relying solely on the 20-day EMA for decision-making lacks multi-indicator confirmation mechanisms, potentially generating false signals.
-
Backtest Bias Risk: Simple moving average strategies may perform well in backtests but could face impacts from slippage, liquidity, and commission factors in live trading.
-
Lack of Market Environment Filtering: No strategy parameter adjustments based on different market environments (such as trend strength, volatility), limiting adaptability.
Strategy Optimization Directions
-
Add Trend Strength Filtering: Introduce trend strength indicators such as ADX (Average Directional Index), trading only in clearly trending market environments to avoid frequent trading in choppy markets.
-
Multi-timeframe Confirmation Mechanism: Combine trend direction confirmation from higher timeframes (e.g., weekly) and lower timeframes (e.g., 4-hour) to improve signal quality.
-
Dynamic Stop-Loss Settings: Introduce ATR (Average True Range) indicator for dynamic stop-loss, adjusting risk exposure based on market volatility.
-
Optimize Capital Management: Adjust position size based on volatility or risk, for example, reducing positions during high volatility and increasing positions during low volatility.
-
Add Volume Confirmation: Incorporate volume analysis to ensure breakout signals have sufficient volume support, enhancing signal reliability.
-
Parameter Optimization and Adaptation: Optimize the EMA period parameter, even considering using adaptive moving averages (such as KAMA) to better adapt to different market conditions.
-
Add Profit Protection Mechanism: Design trailing stop-loss functionality to protect profits in trending markets, improving the risk-reward ratio.
-
Add Seasonality or Time Filters: Add time filtering conditions to optimize trading timing based on potential seasonal patterns for specific assets.
Summary
The EMA 20 Breakout Trend Following Quantitative Trading Strategy is a simple yet classic trend following system that trades based on price crossovers with the 20-day EMA. The strategy's greatest advantage lies in its clear logic, ease of execution, and monitoring, particularly suitable for markets with defined trends. However, as a single-indicator strategy, it also faces typical risks such as poor performance in ranging markets and signal lag.
Through improvements in trend strength filtering, multi-timeframe confirmation, dynamic stop-losses, and optimized capital management, this strategy can be significantly enhanced. Traders using this strategy should focus on market environment compatibility and make targeted adjustments based on the characteristics of specific trading instruments.
Overall, this is a fundamental strategy suitable for beginners entering quantitative trading and can also serve as a basic component for more complex trading systems. Through continuous optimization and refinement, it has the potential to become a robust trading system contributing sustainable alpha returns to investment portfolios.
- 1