Triple Candle Breakout Momentum Heikin-Ashi Trading System

Overview
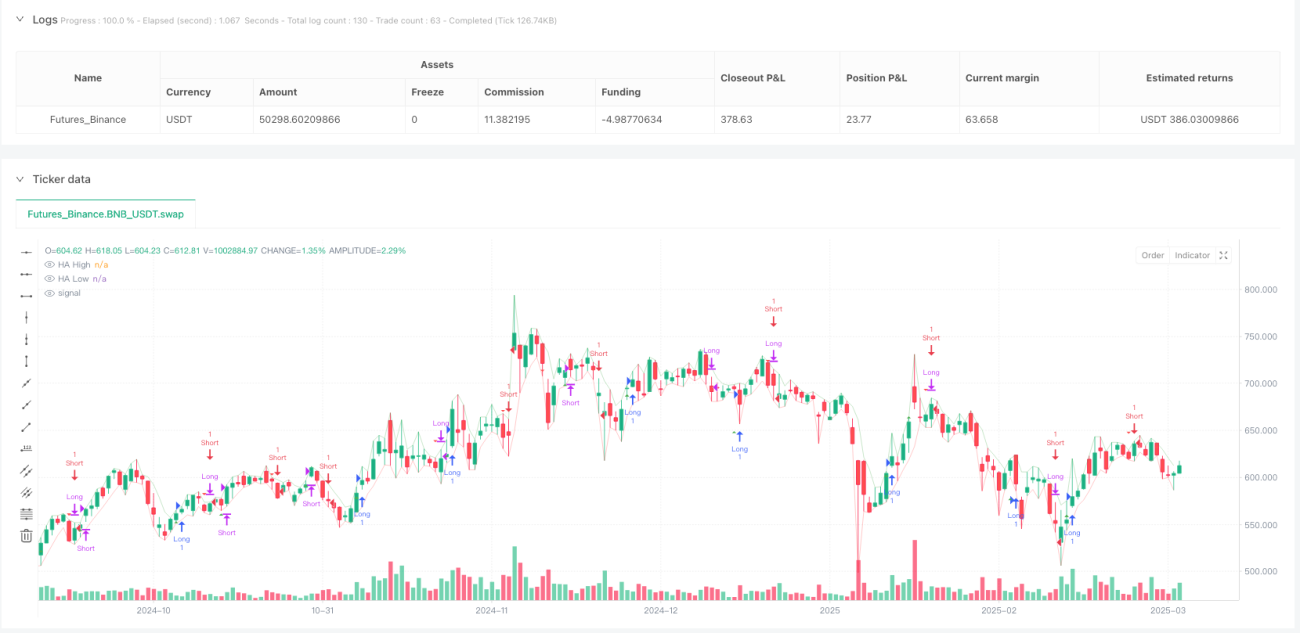
The Triple Candle Breakout Momentum Heikin-Ashi Trading System is a trend-following strategy based on Heikin-Ashi candlestick charts that identifies consecutive market trends and enters trades after momentum confirmation. The core concept involves observing three consecutive Heikin-Ashi candles of the same color, waiting for a reversal candle to appear, and then entering the market when price breaks through the high or low of that reversal candle. This approach aims to capture momentum breakouts following trend reversals, improving entry timing precision and reducing false signals. The strategy is particularly effective for medium to long-term trend following, as it uses Heikin-Ashi candles to smooth price data, filter market noise, and incorporates strict entry and exit conditions to ensure reliable trading signals.
Strategy Principles
The core of this strategy is the Heikin-Ashi candlestick technique, a modified candlestick chart originating from Japan that smooths price fluctuations by calculating averages of open, close, high, and low prices. Unlike traditional candlesticks, Heikin-Ashi candles more clearly display trend direction while reducing the impact of market noise.
The strategy operates as follows:
-
Calculating Heikin-Ashi Values:
- HA Close = (Open + High + Low + Close) / 4
- HA Open = (Previous HA Open + Previous HA Close) / 2
- HA High = Maximum value among High, HA Open, and HA Close
- HA Low = Minimum value among Low, HA Open, and HA Close
-
Long Entry Logic:
- Identify three consecutive red (bearish) HA candles, followed by a green (bullish) candle
- Record the high of this green candle
- Trigger a long entry signal when the next candle breaks above the high of that green candle
-
Long Exit Logic:
- After a long entry, wait for the first red HA candle to form
- Record the low of this red candle
- Trigger a long exit signal when price breaks below the low of that red candle
-
Short Entry Logic:
- Identify three consecutive green (bullish) HA candles, followed by a red (bearish) candle
- Record the low of this red candle
- Trigger a short entry signal when the next candle breaks below the low of that red candle
-
Short Exit Logic:
- After a short entry, wait for the first green HA candle to form
- Record the high of this green candle
- Trigger a short exit signal when price breaks above the high of that green candle
This design ensures that traders only enter the market after confirming trend momentum, increasing the probability of successful trades.
Strategy Advantages
Through in-depth code analysis, the following significant advantages can be identified:
-
Noise Filtering: Heikin-Ashi candlestick technique smooths price data, reducing the impact of market noise and false signals, making trend direction clearer.
-
Momentum Confirmation: The strategy requires three consecutive same-colored candles followed by a reversal candle, and a break of key price levels to trigger signals, creating a multi-confirmation mechanism that improves signal reliability.
-
Precise Entry Timing: By waiting for price to break through key levels, the strategy ensures entry only after trend momentum is clearly established, avoiding the risks of early entry during false breakouts.
-
Clear Exit Rules: The strategy establishes definitive stop-loss conditions, automatically exiting when the market forms a reverse candle and breaks through its key level, reducing holding risk and protecting profits.
-
Visual Feedback: The strategy provides clear visual signals, including graphical markers for trade signals and visualization of Heikin-Ashi highs and lows, allowing traders to intuitively understand market conditions.
-
Flexible Alert System: Built-in alert conditions help traders receive timely notifications of potential trading opportunities, improving operational efficiency.
-
High Adaptability: Although there are no explicit parameter settings in the code, the basic logic of the strategy can easily adapt to different timeframes and market conditions, enhancing its practicality.
Strategy Risks
Despite its many advantages, the strategy also has some potential risks and limitations:
-
Lag Risk: While Heikin-Ashi candles smooth prices, they also introduce some lag. This may cause missed optimal entry or exit points in rapidly reversing markets.
Solution: Combine with more sensitive technical indicators, such as RSI or MACD, to identify potential reversal signals in advance.
-
Poor Performance in Ranging Markets: Trend-following strategies typically perform poorly in sideways, consolidating markets, potentially generating frequent false breakout signals leading to consecutive losses.
Solution: Add market structure assessment logic, such as using the ADX indicator to filter low-volatility environments, or temporarily disable the strategy in ranging markets.
-
Fixed Parameter Risk: The strategy uses a fixed three-candle rule, which may not be optimal across different market conditions.
Solution: Parameterize the consecutive candle count, allowing adjustment based on different markets and timeframes.
-
Lack of Stop-Loss Mechanism: While the strategy has clear exit rules, it does not set hard stops, which may lead to larger losses under extreme market conditions.
Solution: Add ATR-based or fixed percentage stop-loss mechanisms to limit maximum loss per trade.
-
Backtest Overfitting Risk: The strategy may perform well under specific market conditions but may not be applicable to all market environments.
Solution: Backtest across different timeframes and market conditions to ensure strategy robustness.
Strategy Optimization Directions
Based on in-depth code analysis, here are several possible optimization directions:
-
Parameter Optimization:
Make the consecutive candle count an adjustable parameter rather than fixed at three. Different markets and timeframes may require different confirmation counts, and parameterization allows optimization for specific asset classes. This increases strategy adaptability, maintaining good performance across different market environments. -
Add Volatility Filtering:
Integrate the ATR (Average True Range) indicator to assess market volatility and adjust entry conditions accordingly. More stringent confirmation may be needed in high-volatility environments, while conditions can be relaxed in low-volatility environments. This helps reduce false breakout trades in low-volatility conditions. -
Add Trend Filters:
Introduce ADX (Average Directional Index) or moving average systems to confirm overall market trend direction, only considering signals when trends are clearly defined. For example, only consider trend trades when ADX > 25, significantly improving strategy performance in trending markets. -
Improve Stop-Loss Mechanism:
Add ATR-based dynamic stops or trailing stop functionality for more flexible profit protection. For instance, set initial stops at 1.5 times ATR distance from entry price, adjusting stop levels as price moves favorably. -
Add Volume Confirmation:
Require breakout signals to be accompanied by increased trading volume to enhance signal reliability. Volume confirmation helps distinguish between genuine and false breakouts, improving entry precision. -
Risk Management Optimization:
Add position sizing functionality to automatically calculate appropriate trade size based on market volatility and account size. This can be implemented by setting each trade's risk at no more than 1-2% of the account, effectively controlling drawdowns. -
Multi-Timeframe Analysis:
Incorporate longer timeframe trend confirmation, only entering when trends align across multiple timeframes. For example, only consider entries when both daily and 4-hour periods show aligned trends, increasing win rates.
Summary
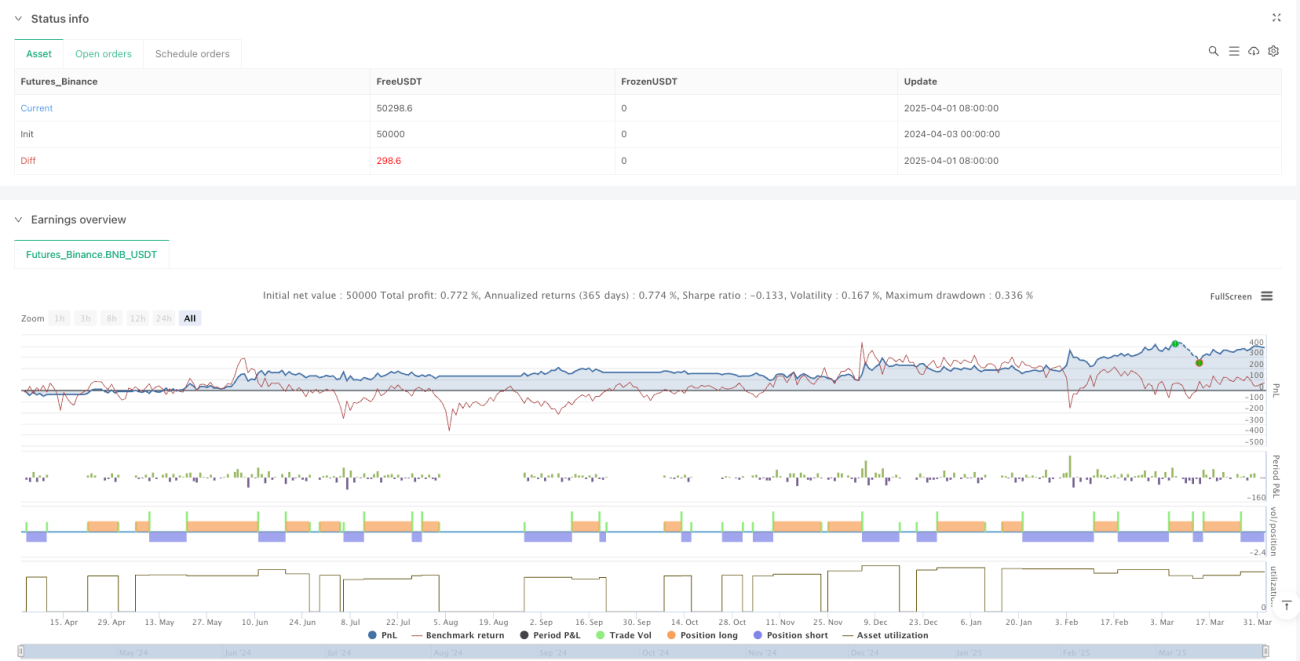
The Triple Candle Breakout Momentum Heikin-Ashi Trading System is a trading system that combines Heikin-Ashi candlestick smoothing techniques with trend breakout concepts. It identifies patterns formed by three consecutive same-colored candles and waits for price to break through key levels to confirm trend momentum, providing high-quality trading signals. The strategy's main advantages lie in its ability to effectively filter market noise, provide clear entry and exit conditions, and improve trade signal reliability through multiple confirmation mechanisms.
However, the strategy also has some potential risks, such as Heikin-Ashi lag, poor performance in ranging markets, lack of adaptive parameters, and others. Performance and robustness can be further improved through adding trend filters, volatility adjustments, improved stop-loss mechanisms, volume confirmation, and other optimization measures.
Overall, this is a well-designed trend-following system particularly suitable for medium to long-term traders. With reasonable parameter optimization and risk management, the strategy can provide stable trading opportunities across various market environments. For traders seeking trend-following methods, this represents a worthwhile basic strategy framework that can be further customized and optimized according to personal trading style and market preferences.
- 1