Multi-Factor Mean Reversion Strategy: A Mean Reversion Trading System Combining Stochastic RSI and Bollinger Bands

Overview
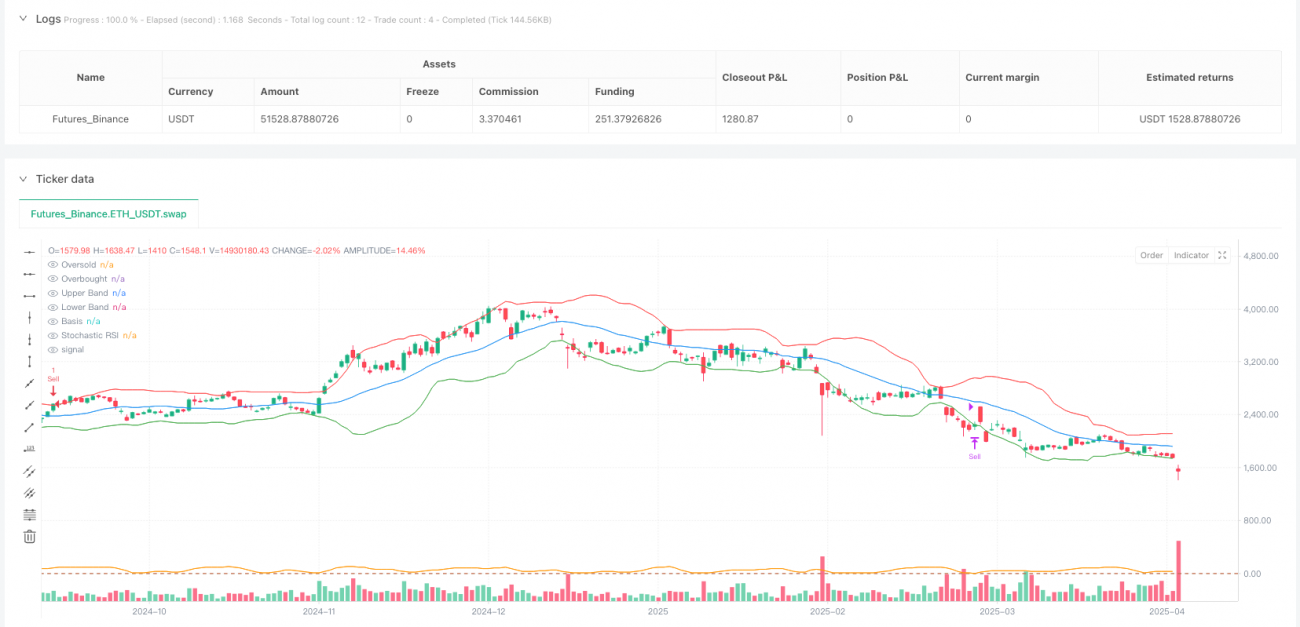
This strategy is a multi-factor mean reversion trading system that combines the Stochastic Relative Strength Index (Stochastic RSI) and Bollinger Bands. It operates on a 5-minute timeframe, primarily designed to capture price reversion opportunities during market overbought and oversold conditions. The core concept of the strategy is to buy when the price is at the lower Bollinger Band and the Stochastic RSI is below 0.1 (oversold region), and to sell when the price is at the upper Bollinger Band and the Stochastic RSI is above 0.9 (overbought region). This multi-factor combination effectively enhances the reliability of trading signals, filtering out potential false signals that might arise from using a single indicator.
Strategy Principles
The strategy is based on the combination of two technical indicators:
-
Stochastic Relative Strength Index (Stochastic RSI):
- First, calculate the basic RSI value:
rsi = ta.rsi(request.security(syminfo.tickerid, "5", close), length) - Then calculate the stochastic based on RSI:
k = ta.sma(ta.stoch(rsi, rsi, rsi, length), smoothK) - Next, calculate the smoothed moving average of K:
d = ta.sma(k, smoothD) - Finally, take the average of K and D lines as the Stochastic RSI:
stochRSI = (k + d) / 2
- First, calculate the basic RSI value:
-
Bollinger Bands:
- Middle Band (Basis): 20-period simple moving average:
basis = ta.sma(request.security(syminfo.tickerid, "5", close), bbLength) - Standard Deviation:
dev = bbStdDev * ta.stdev(request.security(syminfo.tickerid, "5", close), bbLength) - Upper Band: Middle Band plus 2 times standard deviation:
upperBand = basis + dev - Lower Band: Middle Band minus 2 times standard deviation:
lowerBand = basis - dev
- Middle Band (Basis): 20-period simple moving average:
Trading Logic:
- Buy Condition:
stochRSI < 0.1 and close <= lowerBand(Stochastic RSI below 0.1 and price touching or breaking through the lower Bollinger Band) - Sell Condition:
stochRSI > 0.9 and close >= upperBand(Stochastic RSI above 0.9 and price touching or breaking through the upper Bollinger Band)
Exit Logic:
- Long Position Close: Stochastic RSI rises above 0.2:
exitBuyCondition = stochRSI > 0.2 - Short Position Close: Stochastic RSI falls below 0.8:
exitSellCondition = stochRSI < 0.8
The strategy also sets entry price, stop loss, and take profit parameters, but in the code, the stop loss values are set to 0 and 1, and take profit values are set to 0.8 and 0.2 respectively. These parameters need to be optimized based on the actual trading asset.
Strategy Advantages
-
Multi-Factor Collaborative Confirmation: By combining Stochastic RSI and Bollinger Bands, the strategy can more accurately identify overbought and oversold areas, reducing false signals and improving trading efficiency.
-
Mean Reversion Concept: The strategy is based on the theoretical foundation that market prices tend to revert to the mean, a concept that has been validated in many financial markets and is particularly suitable for ranging markets with oscillations.
-
Quantified Entry and Exit Criteria: The strategy provides clear entry and exit conditions, reducing subjective judgment and helping traders maintain discipline.
-
High Adaptability: The various parameters in the strategy (such as RSI length, Bollinger Bands standard deviation multiplier, etc.) can be adjusted through input parameters, allowing the strategy to adapt to different market environments and trading instruments.
-
Visual Support: The strategy code includes indicator visualization components, making it convenient for traders to monitor and analyze.
-
5-Minute Timeframe: The strategy is based on a 5-minute timeframe, capable of capturing short-term trading opportunities, making it suitable for intraday traders.
Strategy Risks
-
Risks in Trending Markets: In strong trending markets, mean reversion strategies may frequently generate false signals, leading to consecutive losses. The solution is to add a trend filter, enabling the strategy only when the market is ranging.
-
False Breakout Risk: Prices may temporarily break through the Bollinger Bands before reverting, causing erroneous signals. The solution is to add confirmation mechanisms, such as requiring the price to maintain a certain duration or magnitude after breaking through the Bollinger Bands.
-
Unreasonable Stop Loss Settings: The current stop loss settings in the code (0 and 1) may not be applicable to actual trading. The solution is to set reasonable stop loss percentages based on the volatility characteristics of the trading instrument.
-
Over-Optimization of Parameters: Excessive parameter optimization may cause the strategy to perform well on historical data but fail in future live trading. The solution is to use a rolling window method for parameter optimization to avoid overfitting.
-
Lack of Market Environment Adaptability: Different market environments (such as high volatility vs. low volatility) may require different parameter settings. The solution is to establish a volatility adaptive mechanism to dynamically adjust parameters based on market conditions.
-
Impact of Slippage and Trading Costs: High-frequency trading strategies are significantly affected by slippage and trading costs. The solution is to fully consider these factors in backtesting and live trading, and possibly raise signal thresholds to reduce the number of trades.
Strategy Optimization Directions
-
Add Trend Filters: Introduce trend indicators such as ADX (Average Directional Index). When the ADX value is above a specific threshold (e.g., 25), indicating that the market is in a strong trend, the mean reversion strategy can be paused or parameters adjusted.
-
Optimize Stop Loss Mechanism: The current stop loss settings in the strategy are not fully developed. Consider using ATR (Average True Range) to set dynamic stop losses, for example:
stopLoss = entryPrice - (atrValue * 1.5)(for long positions) orstopLoss = entryPrice + (atrValue * 1.5)(for short positions). -
Add Volume Confirmation: When entry signals are triggered, add volume confirmation conditions, such as requiring the current trading volume to be higher than the average trading volume of the previous N periods, to ensure sufficient market liquidity to support price reversal.
-
Time Filter: Some markets experience high and irregular volatility during specific time periods (such as around market open and close). Adding a time filter can help avoid these periods.
-
Introduce Machine Learning Optimization: Use machine learning algorithms (such as random forests or neural networks) to optimize the weights or parameters of various indicators, enabling the strategy to better adapt to different market environments.
-
Enhance Backtest Robustness Testing: Implement Monte Carlo simulations or walk-forward testing to evaluate the robustness of the strategy under different market conditions.
-
Dynamic Parameter Adjustment: Automatically adjust the standard deviation multiplier of Bollinger Bands based on market volatility, using higher multipliers in high-volatility environments and lower multipliers in low-volatility environments.
Summary
The "Multi-Factor Mean Reversion Strategy: A Mean Reversion Trading System Combining Stochastic RSI and Bollinger Bands" is a trading strategy based on technical analysis. It identifies market overbought and oversold conditions by combining Stochastic RSI and Bollinger Bands indicators to capture trading opportunities when prices revert to the mean. The core advantage of this strategy lies in its multi-factor confirmation mechanism and clear quantified trading rules. However, in practical application, attention still needs to be paid to risks in trending markets and issues such as parameter over-optimization.
By adding trend filters, optimizing stop loss mechanisms, introducing volume confirmation, and implementing dynamic parameter adjustments, this strategy has the potential to achieve more stable performance in various market environments. For traders pursuing mean reversion trading opportunities, this strategy provides a systematic framework, but successful application still requires traders to make personalized adjustments based on their own experience and risk management capabilities.
- 1