
The Multi-Dimensional Adaptive Moving Average Matrix with ATR-Powered Precision Trading Strategy is an advanced quantitative trading system designed for rapidly changing market conditions. The core of this strategy lies in combining multiple types of moving averages with ATR (Average True Range) filters to form a highly flexible and adaptive trading matrix. By precisely capturing market trends and volatility, this strategy can identify high-probability entry and exit points in high-frequency trading environments while implementing strict risk control measures. The strategy’s notable feature is its multi-layered adaptability - from the flexible selection of various moving average types to dynamic ATR-based stop-loss and profit target settings, to multi-timeframe trend filtering, enabling intelligent adjustment of trading signal generation across various market environments.
The core principles of this strategy are built on the collaborative work of several key components:
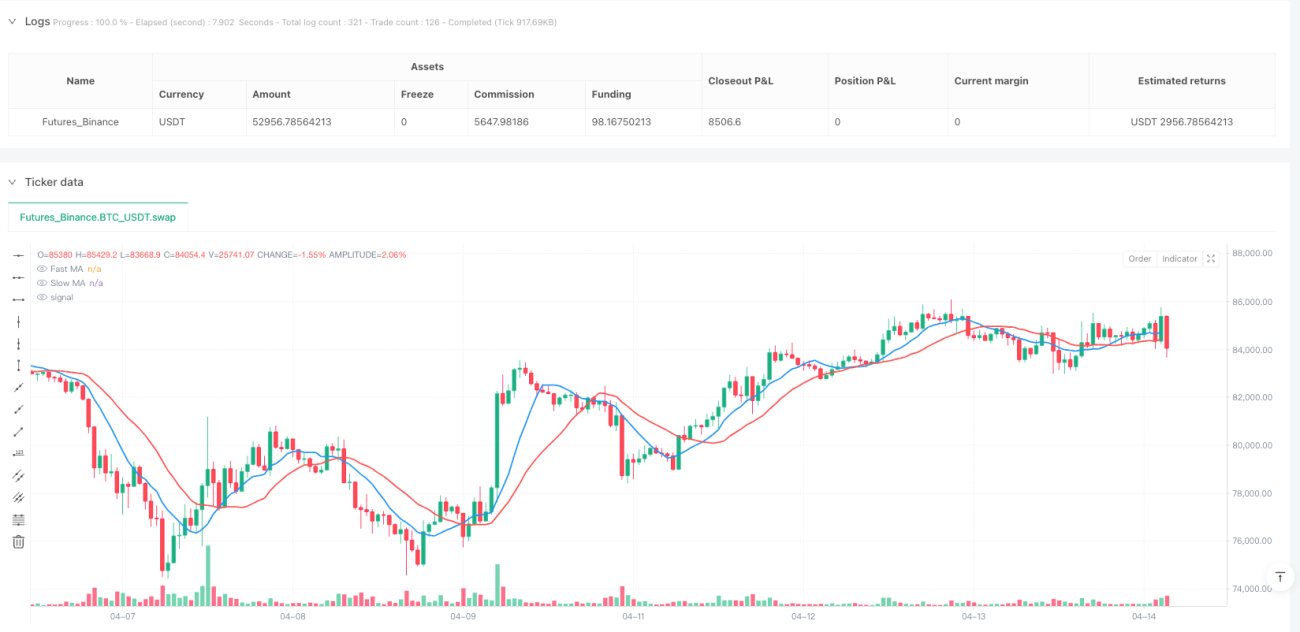
Advanced Moving Average Matrix: The strategy implements up to 11 different types of moving averages, including SMA, EMA, SMMA, HMA, TEMA, WMA, VWMA, ZLEMA, ALMA, KAMA, and DEMA. Each moving average has its unique calculation method and response characteristics, which can be flexibly selected based on market conditions. The system uses two moving averages (fast and slow) as the primary trend indicators, and their crossovers and relative positions are used to generate basic trading signals.
ATR-Based Risk Management: The strategy uses the ATR indicator to measure market volatility and applies it in multiple aspects:
Multi-Timeframe Trend Filtering: The strategy enhances signal reliability by querying moving average trends in a higher timeframe (15 minutes), ensuring that the trading direction aligns with the larger market trend.
Volume and Time Window Validation: Trades are only executed when meeting minimum volume requirements, experiencing volume breakouts, and within a predefined trading time window, further improving trade quality.
Signal Generation Logic:
Comprehensive Exit Logic: The strategy employs a three-tiered exit mechanism: fixed stop-loss (multiples of ATR), target profit (multiples of ATR), and trailing stop (dynamic adjustment based on ATR), providing comprehensive risk protection for each trade.
Analyzing the strategy code reveals the following significant advantages:
Exceptional Adaptability: Through switchable multiple moving average types (from HMA to KAMA, etc.), the strategy can adapt to different market conditions. This flexibility allows traders to select the optimal indicator based on the current market environment without rewriting the entire strategy.
Dynamic Risk Management: ATR-based risk control mechanisms ensure that stop-losses and profit targets automatically adjust according to market volatility. This approach provides better protection in volatile markets while allowing for capturing more profits in trending markets.
Multi-Layer Signal Filtering: By combining moving average crossovers, volume analysis, volatility thresholds, and multi-timeframe trend filtering, the strategy effectively reduces false signals and improves trade quality. Particularly, the 15-minute timeframe trend filtering feature significantly reduces the possibility of counter-trend trading.
Precise Entry Conditions: The strategy not only relies on technical indicator crossovers but also requires sufficient ATR distance between price and the slow moving average, which helps avoid frequent trading in sideways markets and reduces losses from false breakouts.
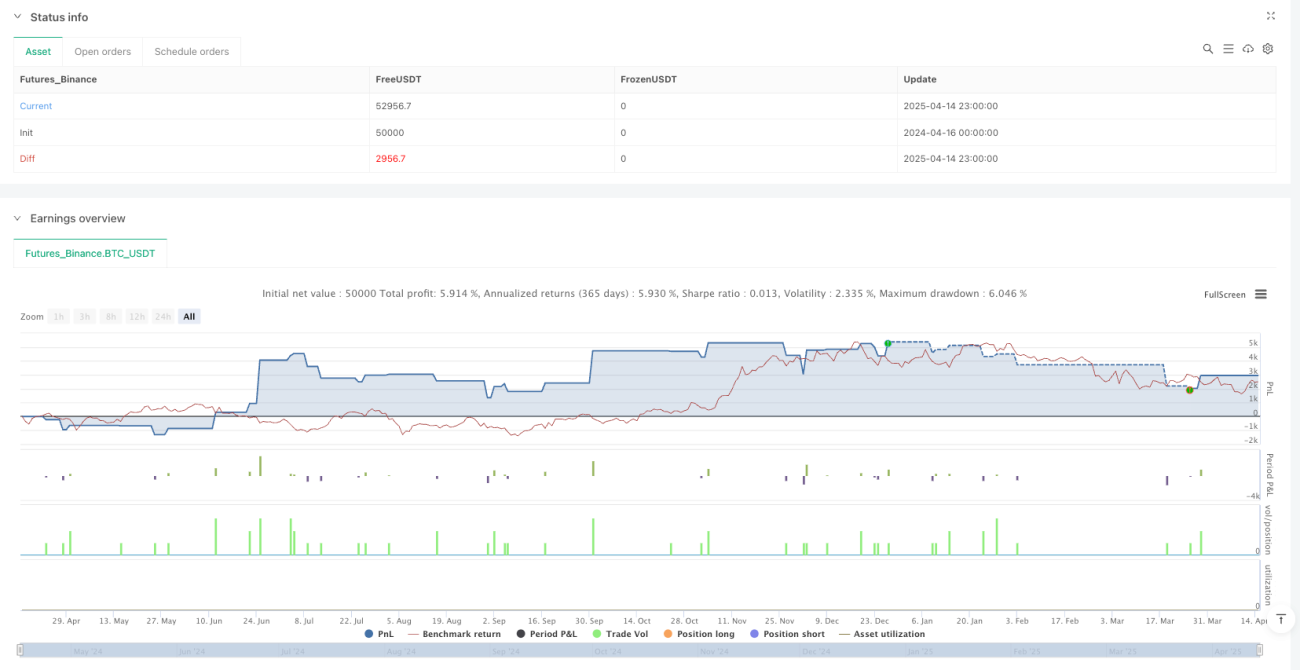
Transparent Performance Monitoring: The built-in dashboard provides real-time display of key performance indicators, including current profit/loss, equity, ATR (both raw and percentage), and the gap between moving averages, enabling traders to evaluate the strategy’s status at any time.
Despite being well-designed, the strategy still has the following potential risks:
Parameter Optimization Traps: The strategy includes numerous parameters (moving average types and periods, ATR period and multipliers, etc.), and excessive optimization may lead to curve fitting, causing the strategy to perform poorly in live trading. The solution is to conduct robust cross-market and cross-timeframe testing, avoiding excessive parameter adjustments.
Rapid Reversal Risk: Despite using ATR dynamic stop-losses, in sudden market reversals (such as after major news releases), prices may gap before stop-losses trigger, resulting in losses beyond expectations. It is recommended to implement additional overnight risk controls or pause trading before high-volatility events.
Signal Delay: All moving averages inherently have lag. Even low-latency variants like HMA or ZLEMA may miss ideal entry points in fast markets. Consider combining momentum or price action indicators to supplement the existing signal system.
Volume Dependency: The strategy issues signals during volume surges, but in some markets or periods, volume may be misleading. Adjust volume filters when necessary or consider disabling this feature under specific market conditions.
Time Window Limitations: The specified trading time window may miss important overnight or early market opportunities. It is recommended to adjust trading time settings according to the most active periods of specific markets.
After analyzing the code, here are several possible optimization directions:
Adaptive Parameter Adjustment: Currently, the strategy uses fixed parameter settings. An advanced optimization would be to implement parameters that automatically adjust based on market state (trend, volatility, range). For example, ATR multipliers can automatically increase during high volatility periods, or moving average types can switch in different market environments.
Integration of Machine Learning Models: Introduce a machine learning layer to predict which moving average type might perform best under current market conditions, thereby automatically selecting the optimal moving average combination. This can be achieved by analyzing the relative performance of different indicators in historical data.
Improved Trend Identification: In addition to the existing 15-minute trend filter, more complex trend recognition algorithms can be incorporated, such as the Hurst Exponent or Directional Movement Index (DMI), to more accurately determine trend strength and persistence.
Enhanced Exit Strategy: The current exit strategy can be further optimized by adding exit signals based on market structure, such as trendline breakouts, key support/resistance levels, or abrupt volatility changes. This can help lock in profits before the trend ends.
Risk-Adjusted Position Sizing: Implement dynamic position sizing adjustments based on current volatility and account funds, rather than using fixed trade quantities. For example, reduce positions during high volatility and moderately increase positions during low volatility to optimize the risk-reward ratio.
Related Market Filtering: Enhance signal quality by monitoring related markets (such as watching VIX when trading stock indices) or cross-asset correlations. When related markets show consistent directional movement, the credibility of trades can be increased.
The Multi-Dimensional Adaptive Moving Average Matrix with ATR-Powered Precision Trading Strategy represents a comprehensive and advanced approach to quantitative trading. By combining the strengths of multiple moving average types with strict ATR-based risk control, the strategy can adapt to different market conditions while maintaining good risk management. Its multi-layered signal filtering mechanism, precise entry conditions, and comprehensive exit logic collectively create a powerful system capable of identifying high-probability trading opportunities.
The true value of this strategy lies in its flexibility and adaptability, allowing traders to customize it according to specific markets and personal risk preferences. Through the suggested optimization directions, especially adaptive parameter adjustment and machine learning integration, the strategy’s performance has the potential for further improvement.
For traders seeking to employ a technically strong and disciplined system in high-frequency trading environments, this strategy provides a solid framework combining technical precision and risk control, both of which are essential. Importantly, traders should validate the strategy’s performance in their target markets through thorough backtesting and simulated trading, making necessary adjustments according to specific trading environments.
/*backtest
start: 2024-04-16 00:00:00
end: 2025-04-15 00:00:00
period: 1h
basePeriod: 1h
exchanges: [{"eid":"Futures_Binance","currency":"BTC_USDT"}]
*/
//@version=6
strategy("Dskyz (DAFE) MAtrix with ATR-Powered Precision",
overlay=true,
default_qty_type=strategy.fixed,
initial_capital=1000000,
commission_value=0,
slippage=1,
pyramiding=10)
// ==================================================================
// USER-DEFINED FUNCTIONS
// ==================================================================
// Hull Moving Average (HMA)
hma(src, len) =>
halfLen = math.round(len * 0.5)
sqrtLen = math.round(math.sqrt(len))
wmaf = ta.wma(src, halfLen)
wmaFull = ta.wma(src, len)
ta.wma(2 * wmaf - wmaFull, sqrtLen)
// Triple Exponential Moving Average (TEMA)
tema(src, len) =>
ema1 = ta.ema(src, len)
ema2 = ta.ema(ema1, len)
ema3 = ta.ema(ema2, len)
3 * (ema1 - ema2) + ema3
// Double Exponential Moving Average (DEMA)
dema(src, len) =>
ema1 = ta.ema(src, len)
ema2 = ta.ema(ema1, len)
2 * ema1 - ema2
// VWMA - Volume Weighted Moving Average
vwma(src, len) =>
ta.vwma(src, len)
// ZLEMA - Zero Lag EMA
zlema(src, len) =>
lag = math.floor((len - 1) / 2)
ta.ema(2 * src - src[lag], len)
// ALMA - Arnaud Legoux Moving Average
alma(src, len, offset=0.85, sigma=6) =>
ta.alma(src, len, offset, sigma)
// Custom Kaufman Adaptive Moving Average (KAMA)
kama(src, len) =>
fastSC = 2.0 / (2 + 1)
slowSC = 2.0 / (30 + 1)
change = math.abs(src - src[len])
volatility = 0.0
for i = 0 to len - 1
volatility += math.abs(src - src[i])
er = volatility != 0 ? change / volatility : 0.0
sc = math.pow(er * (fastSC - slowSC) + slowSC, 2)
var float kama_val = na
kama_val := na(kama_val) ? ta.sma(src, len) : kama_val + sc * (src - kama_val)
kama_val
// ==================================================================
// INPUTS
// ==================================================================
fastLength = input.int(9, "[MA] Fast MA Length", minval=1)
slowLength = input.int(19, "[MA] Slow MA Length", minval=1)
fastMAType = input.string("SMA", "Fast MA Type", options=["SMA", "EMA", "SMMA", "HMA", "TEMA", "WMA", "VWMA", "ZLEMA", "ALMA", "KAMA", "DEMA"])
slowMAType = input.string("SMA", "Slow MA Type", options=["SMA", "EMA", "SMMA", "HMA", "TEMA", "WMA", "VWMA", "ZLEMA", "ALMA", "KAMA", "DEMA"])
atrPeriod = input.int(14, "ATR Period", minval=1)
atrMultiplier = input.float(1.5, "ATR Multiplier for Filter", minval=0.1, step=0.1)
useTrendFilter = input.bool(true, "[Filter Settings] Use 15m Trend Filter")
minVolume = input.int(10, "Minimum Volume", minval=1)
volatilityThreshold = input.float(1.0, "Volatility Threshold (%)", minval=0.1, step=0.1) / 100
tradingStartHour = input.int(9, "Trading Start Hour (24h)", minval=0, maxval=23)
tradingEndHour = input.int(16, "Trading End Hour (24h)", minval=0, maxval=23)
trailOffset = input.float(0.5, "[Exit Settings] Trailing Stop Offset ATR Multiplier", minval=0.01, step=0.01)
profitTargetATRMult = input.float(1.2, "Profit Target ATR Multiplier", minval=0.1, step=0.1)
fixedStopMultiplier = input.float(1.3, "Fixed Stop Multiplier", minval=0.5, step=0.1)
fixedQuantity = input.int(2, "Trade Quantity", minval=1)
resetDashboard = input.bool(false, "Reset Dashboard Stats")
// ==================================================================
// CALCULATIONS
// ==================================================================
volumeOk = volume >= minVolume
currentHour = hour(time)
timeWindow = currentHour >= tradingStartHour and currentHour <= tradingEndHour
volumeSpike = volume > 1.2 * ta.sma(volume, 10)
// ATR Calculation
atr = ta.atr(atrPeriod)
volatility = nz(atr / close, 0)
volatilityOk = volatility <= volatilityThreshold
// ==================================================================
// MOVING AVERAGES CALCULATIONS
// ==================================================================
var float fastMA = na
var float slowMA = na
// Fast MA Logic
if fastMAType == "SMA"
fastMA := ta.sma(close, fastLength)
else if fastMAType == "EMA"
fastMA := ta.ema(close, fastLength)
else if fastMAType == "SMMA"
fastMA := ta.rma(close, fastLength)
else if fastMAType == "HMA"
fastMA := hma(close, fastLength)
else if fastMAType == "TEMA"
fastMA := tema(close, fastLength)
else if fastMAType == "WMA"
fastMA := ta.wma(close, fastLength)
else if fastMAType == "VWMA"
fastMA := vwma(close, fastLength)
else if fastMAType == "ZLEMA"
fastMA := zlema(close, fastLength)
else if fastMAType == "ALMA"
fastMA := alma(close, fastLength)
else if fastMAType == "KAMA"
fastMA := kama(close, fastLength)
else if fastMAType == "DEMA"
fastMA := dema(close, fastLength)
// Slow MA Logic
if slowMAType == "SMA"
slowMA := ta.sma(close, slowLength)
else if slowMAType == "EMA"
slowMA := ta.ema(close, slowLength)
else if slowMAType == "SMMA"
slowMA := ta.rma(close, slowLength)
else if slowMAType == "HMA"
slowMA := hma(close, slowLength)
else if slowMAType == "TEMA"
slowMA := tema(close, slowLength)
else if slowMAType == "WMA"
slowMA := ta.wma(close, slowLength)
else if slowMAType == "VWMA"
slowMA := vwma(close, slowLength)
else if slowMAType == "ZLEMA"
slowMA := zlema(close, slowLength)
else if slowMAType == "ALMA"
slowMA := alma(close, slowLength)
else if slowMAType == "KAMA"
slowMA := kama(close, slowLength)
else if slowMAType == "DEMA"
slowMA := dema(close, slowLength)
// ==================================================================
// TREND FILTER & SIGNAL LOGIC
// ==================================================================
// Retrieve 15-minute MAs for trend filtering
[fastMA15m, slowMA15m] = request.security(syminfo.tickerid, "15", [ta.sma(close, fastLength), ta.sma(close, slowLength)])
trend15m = fastMA15m > slowMA15m ? 1 : fastMA15m < slowMA15m ? -1 : 0
trendLongOk = not useTrendFilter or trend15m >= 0
trendShortOk= not useTrendFilter or trend15m <= 0
// ATR-based Price Filter
atrFilterLong = close > slowMA + atr * atrMultiplier
atrFilterShort = close < slowMA - atr * atrMultiplier
// Signal Logic: MA alignment + filters
maAbove = close > fastMA and fastMA > slowMA
maBelow = close < fastMA and fastMA < slowMA
longCondition = maAbove and trendLongOk and atrFilterLong and volumeOk and volumeSpike and timeWindow and volatilityOk
shortCondition= maBelow and trendShortOk and atrFilterShort and volumeOk and volumeSpike and timeWindow and volatilityOk
// ==================================================================
// ENTRY LOGIC
// ==================================================================
if strategy.position_size == 0 and longCondition
strategy.entry("Long", strategy.long, qty=fixedQuantity)
if strategy.position_size == 0 and shortCondition
strategy.entry("Short", strategy.short, qty=fixedQuantity)
// ==================================================================
// EXIT LOGIC
// ==================================================================
if strategy.position_size > 0
strategy.exit("Long Exit", "Long",
stop = strategy.position_avg_price - atr * fixedStopMultiplier,
limit = strategy.position_avg_price + atr * profitTargetATRMult,
trail_offset = atr * trailOffset,
trail_points = atr * trailOffset)
if strategy.position_size < 0
strategy.exit("Short Exit", "Short",
stop = strategy.position_avg_price + atr * fixedStopMultiplier,
limit = strategy.position_avg_price - atr * profitTargetATRMult,
trail_offset = atr * trailOffset,
trail_points = atr * trailOffset)
// ==================================================================
// VISUALS: PLOT MAs
// ==================================================================
plot(fastMA, color=color.blue, linewidth=2, title="Fast MA")
plot(slowMA, color=color.red, linewidth=2, title="Slow MA")
// ==================================================================
// METRICS CALCULATIONS (for Dashboard)
// ==================================================================
// Additional metrics:
atrPct = close != 0 ? (atr / close) * 100 : na // ATR as percentage of Close
maGapPct = (slowMA != 0) ? (math.abs(fastMA - slowMA) / slowMA) * 100 : na // % difference between MAs
// Open PnL Calculation
currentPnL = strategy.position_size != 0 ? (close - strategy.position_avg_price) * strategy.position_size : 0
// Persistent variable for highest equity (for drawdown calculation)
var float highestEquity = strategy.equity
highestEquity := math.max(highestEquity, strategy.equity)
totalDrawdown = strategy.equity - highestEquity
// Reset dashboard metrics if reset toggle is on.
if resetDashboard
highestEquity := strategy.equity
// ==================================================================
// DASHBOARD: WATERMARK LOGO (Bottom-Right)
// ==================================================================
var table watermarkTable = table.new(position.bottom_right, 1, 1, bgcolor=color.rgb(0, 0, 0, 80), border_color=color.rgb(0, 50, 137), border_width=1)
if barstate.islast
table.cell(watermarkTable, 0, 0, "⚡ Dskyz - DAFE Trading Systems", text_color=color.rgb(159, 127, 255, 80), text_size=size.large)
// ==================================================================
// DASHBOARD: METRICS TABLE (Bottom-Left)
// ==================================================================
var table dashboard = table.new(position.middle_right, 2, 12, bgcolor=color.new(#000000, 29), border_color=color.rgb(80, 80, 80), border_width=1)
if barstate.islast
// Row 0 – Dashboard Title (duplicated in both columns to simulate spanning)
table.cell(dashboard, 0, 0, "⚡(DAFE) Trading Systems", text_color=color.rgb(135, 135, 135), text_size=size.small)
// Row 1 – Position
table.cell(dashboard, 0, 1, "Position", text_color=color.gray)
positionText = strategy.position_size > 0 ? "Long" : strategy.position_size < 0 ? "Short" : "Flat"
table.cell(dashboard, 1, 1, positionText, text_color=strategy.position_size > 0 ? color.green : strategy.position_size < 0 ? color.red : color.blue)
// Row 2 – Current PnL
table.cell(dashboard, 0, 2, "Current P/L", text_color=color.gray)
table.cell(dashboard, 1, 2, str.tostring(currentPnL, "#.##"), text_color=(currentPnL > 0 ? color.green : currentPnL < 0 ? color.red : color.gray))
// Row 3 – Equity
table.cell(dashboard, 0, 3, "Equity", text_color=color.gray)
table.cell(dashboard, 1, 3, str.tostring(strategy.equity, "#.##"), text_color=color.white)
// Row 4 – Closed Trades
table.cell(dashboard, 0, 4, "Closed Trades", text_color=color.gray)
table.cell(dashboard, 1, 4, str.tostring(strategy.closedtrades), text_color=color.white)
// Row 5 – Title Step
table.cell(dashboard, 0, 5, "Metrics", text_color=color.rgb(76, 122, 23))
// Row 6 – Fast MA
table.cell(dashboard, 0, 6, "Fast MA", text_color=color.gray)
table.cell(dashboard, 1, 6, str.tostring(fastMA, "#.##"), text_color=color.white)
// Row 7 – Slow MA
table.cell(dashboard, 0, 7, "Slow MA", text_color=color.gray)
table.cell(dashboard, 1, 7, str.tostring(slowMA, "#.##"), text_color=color.white)
// Row 8 – ATR (Raw)
table.cell(dashboard, 0, 8, "ATR", text_color=color.gray)
table.cell(dashboard, 1, 8, str.tostring(atr, "#.##"), text_color=color.white)
// Row 9 – ATR (%)
table.cell(dashboard, 0, 9, "ATR (%)", text_color=color.gray)
table.cell(dashboard, 1, 9, str.tostring(atrPct, "#.##") + "%", text_color=color.white)
// Row 10 – MA Gap (%)
table.cell(dashboard, 0, 10, "MA Gap (%)", text_color=color.gray)
table.cell(dashboard, 1, 10, na(maGapPct) ? "N/A" : str.tostring(maGapPct, "#.##") + "%", text_color=color.white)
// Row 11 – Volatility (%)
table.cell(dashboard, 0, 11, "Volatility (%)", text_color=color.gray)
table.cell(dashboard, 1, 11, str.tostring(volatility * 100, "#.##") + "%", text_color=color.white)