EMA Dual Crossover Dynamic Stop-Loss Quantitative Strategy

EMA CROSSOVER STOP-LOSS TREND FOLLOWING TECHNICAL INDICATORS
Created on: 2025-04-24 16:59:03 Modified on: 2025-04-24 16:59:03
Copy: 0 Number of hits: 313
avatar of ianzeng123 ianzeng123
2
Follow
319
Followers

 EMA Dual Crossover Dynamic Stop-Loss Quantitative Strategy  EMA Dual Crossover Dynamic Stop-Loss Quantitative Strategy

Overview

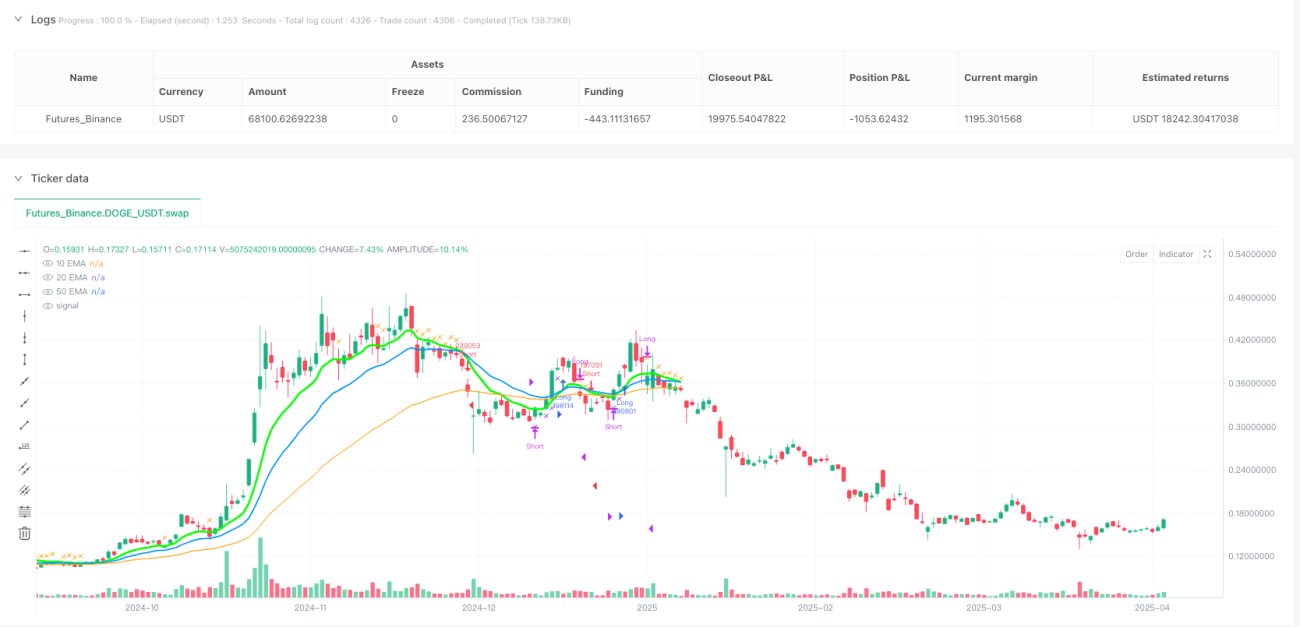
This strategy is designed based on the dual crossover principle of Exponential Moving Averages (EMA) combined with a dynamic stop-loss mechanism. It uses the golden/death cross of 10-day and 20-day EMAs as primary trading signals, with the 50-day EMA as a trend filter and the 10-day EMA as a dynamic stop-loss line. A buy signal is generated when the price is above the 50-day EMA and the 10-day EMA crosses above the 20-day EMA; a sell signal occurs when the price is below the 50-day EMA and the 10-day EMA crosses below the 20-day EMA. Positions are exited if the price reversely breaks the 10-day EMA.

Strategy Logic

  1. Bullish/Bearish Conditions:
    • Bullish: When 10-day EMA crosses above 20-day EMA (golden cross) and closing price is above 50-day EMA.
    • Bearish: When 10-day EMA crosses below 20-day EMA (death cross) and closing price is below 50-day EMA.
  2. Dynamic Stop-Loss:
    • Long positions are closed if price falls below 10-day EMA.
    • Short positions are closed if price rises above 10-day EMA.
  3. Trend Filtering: The 50-day EMA acts as a long-term trend filter to avoid overtrading in ranging markets.

Advantages

  1. Trend-Following Capability: Dual EMA crossover effectively captures medium-term trends, while the 50-day EMA reduces false signals.
  2. Dynamic Risk Management: The 10-day EMA serves as an adaptive stop-loss, protecting profits during trend movements.
  3. Visual Clarity: Distinct colors and line widths differentiate the three EMAs, with annotated signals for real-time monitoring.
  4. Parameter Flexibility: Adjustable EMA periods adapt to varying market volatilities.

Risks

  1. Lagging Risk: EMAs rely on historical data, potentially causing significant drawdowns during rapid reversals.
    • Solution: Incorporate momentum indicators (e.g., RSI) to filter extreme volatility.
  2. Range Market Losses: Frequent whipsaws may occur in trendless conditions.
    • Solution: Add volatility filters (e.g., ATR) to pause trading.
  3. Overfitting Risk: Fixed EMA periods may not suit all market regimes.
    • Solution: Implement adaptive period algorithms or multi-timeframe confirmation.

Optimization Directions

  1. Composite Signals:
    • Add volume confirmation (e.g., breakout with high volume) to enhance signal reliability.
  2. Dynamic Position Sizing:
    • Adjust position size based on volatility (ATR values) to reduce exposure in high-risk periods.
  3. Machine Learning:
    • Train models on historical data to dynamically optimize EMA period combinations.
  4. Multi-Timeframe Validation:
    • Require weekly EMA alignment with daily signals to improve win rates.
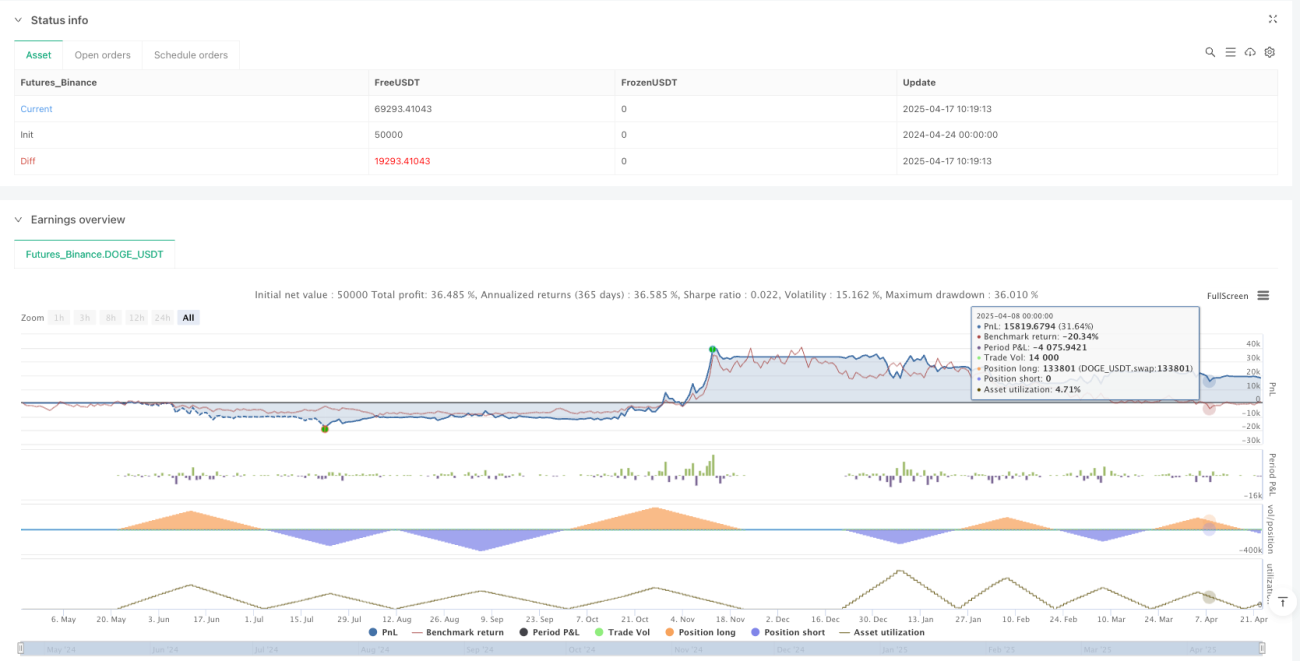
Conclusion

This strategy balances trend-following and risk control through EMA dual crossover and dynamic stop-loss. Its core strengths lie in clear logic and intuitive visualization, making it suitable for medium-low frequency trading. Future enhancements could integrate multidimensional data (e.g., volatility, volume) for greater robustness.

Strategy source code
/*backtest
start: 2024-04-24 00:00:00
end: 2025-04-23 00:00:00
period: 1d
basePeriod: 1d
exchanges: [{"eid":"Futures_Binance","currency":"DOGE_USDT"}]
*/

//@version=5
//@description Ovtlyer EMA Crossover  price over 50 Indicator
//@author YourName

strategy("EMA Crossover Strategy", overlay=true, default_qty_type=strategy.percent_of_equity, default_qty_value=100)

// Input EMA lengths
length10 = input.int(10, minval=1, title="10 EMA Length")
length20 = input.int(20, minval=1, title="20 EMA Length")
length50 = input.int(50, minval=1, title="50 EMA Length")

// Calculate EMAs
ema10 = ta.ema(close, length10)
ema20 = ta.ema(close, length20)
ema50 = ta.ema(close, length50)

// Bullish Condition: 10 EMA crosses above 20 EMA AND price is above 50 EMA
bullishCondition = ta.crossover(ema10, ema20) and close > ema50

// Bearish Condition: 10 EMA crosses below 20 EMA AND price is below 50 EMA
bearishCondition = ta.crossunder(ema10, ema20) and close < ema50

// Track the current market state
var isBullish = false
var isBearish = false

if (bullishCondition)
    isBullish := true
    isBearish := false

if (bearishCondition)
    isBearish := true
    isBullish := false

// Exit conditions
bullishExit = isBullish and close < ema10
bearishExit = isBearish and close > ema10

// Plot EMAs
plot(ema10, title="10 EMA", color=color.rgb(0, 255, 0), linewidth=3) // Thick green line for 10 EMA
plot(ema20, title="20 EMA", color=color.rgb(0, 150, 255), linewidth=2) // Medium blue line for 20 EMA
plot(ema50, title="50 EMA", color=color.rgb(255, 165, 0), linewidth=1) // Thin orange line for 50 EMA

// Strategy Entry and Exit
if (bullishCondition)
    strategy.entry("Long", strategy.long)

if (bearishCondition)
    strategy.entry("Short", strategy.short)

if (bullishExit)
    strategy.close("Long")

if (bearishExit)
    strategy.close("Short")

// Plot Entry Signals (for visualization)
plotshape(bullishCondition, title="Bullish Signal", 
          location=location.belowbar, style=shape.triangleup, 
          size=size.small, color=color.green)
plotshape(bearishCondition, title="Bearish Signal", 
          location=location.abovebar, style=shape.triangledown, 
          size=size.small, color=color.red)

// Plot Exit Signals (for visualization)
plotshape(bullishExit, title="Bullish Exit", 
          location=location.abovebar, style=shape.xcross, 
          size=size.small, color=color.orange)
plotshape(bearishExit, title="Bearish Exit", 
          location=location.belowbar, style=shape.xcross, 
          size=size.small, color=color.purple)