Trend Momentum Penetration Indicator Trading Strategy

Overview
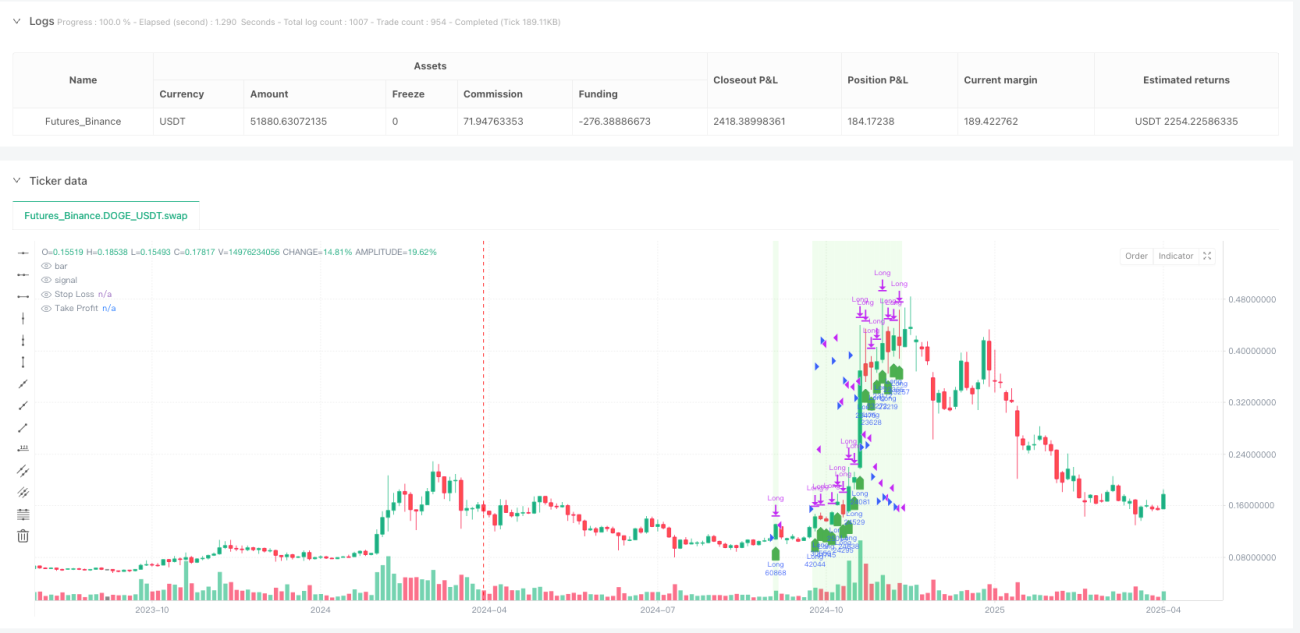
The Trend Momentum Penetration Indicator Trading Strategy is a quantitative trading system based on a combination of daily chart technical indicators. It primarily utilizes moving average systems, volatility indicators, volume confirmation, and price momentum to identify potential trending markets and enter positions when key technical levels are breached. The strategy confirms long-term trend direction through daily EMA systems, identifies price breakouts using ATR volatility indicators, and employs volume indicators and candlestick patterns as auxiliary confirmation signals, thereby constructing a multi-factor market entry system.
Strategy Principles
The core principle of this strategy is based on the synergy of multiple technical indicators forming a complete trading system. Specifically, the strategy confirms entry signals through the following four conditions:
-
Trend Confirmation Condition: By determining whether the 50-day moving average is above the 100-day moving average (dailyEMA50 > dailyEMA100), confirming that the market is in an uptrend.
-
Breakout Confirmation Condition: By determining whether the daily closing price has broken through the level of the 10-day moving average plus ATR (dailyClose > ema_plus_atr), indicating that the price has broken through the upper band of the recent volatility range, showing strong upward momentum.
-
Candlestick Pattern Confirmation: By determining whether the daily closing price is higher than the opening price (dailyClose > dailyOpen), confirming that the day is a bullish candle, indicating buyer dominance.
-
Volume Confirmation: By determining whether the daily volume is higher than the 12-day volume moving average (dailyVol > dailyVolEMA12), confirming increased market participation and enhancing signal reliability.
When these four conditions are simultaneously met, the strategy generates an entry signal on the daily chart. After entry, the strategy sets ATR-based stop-loss and take-profit points:
- Stop-loss level: 10-day moving average minus ATR (ema_minus_atr)
- Take-profit level: 10-day moving average plus 3 times ATR (ema_plus_atr1)
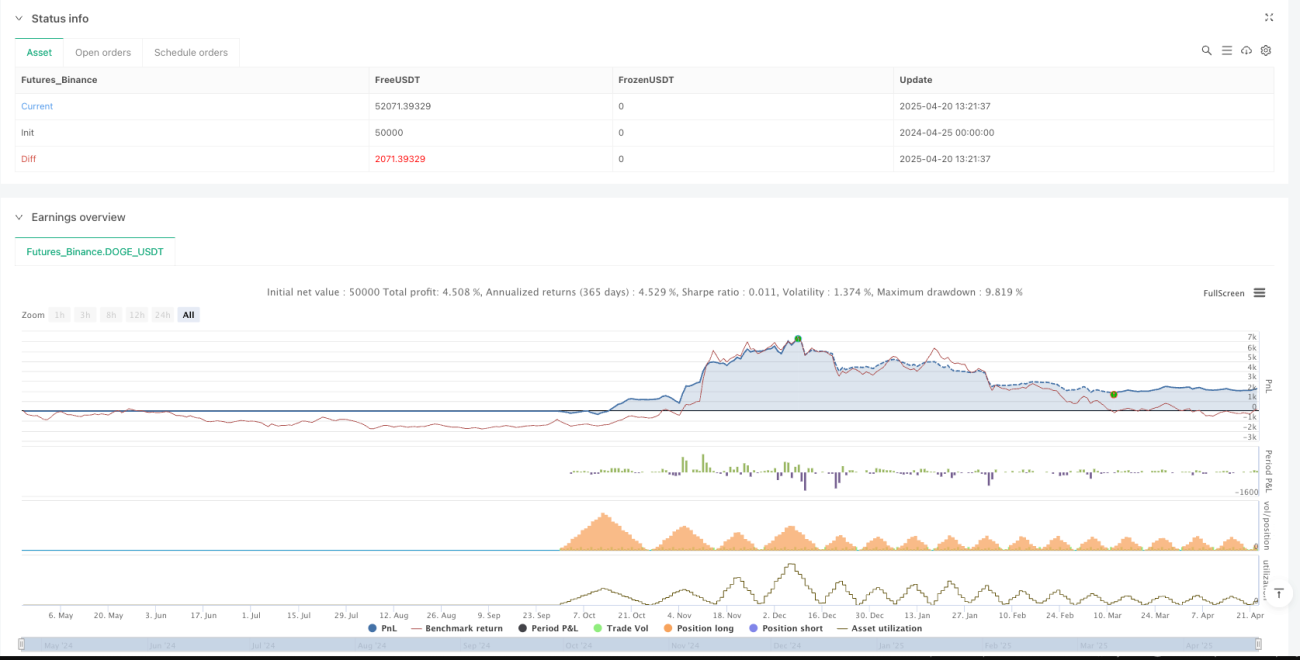
Additionally, the strategy implements a risk management mechanism, controlling the risk per trade within 2% of account equity by calculating the risk per share and the number of shares that can be traded.
Strategy Advantages
-
Multi-dimensional Signal Confirmation: The strategy combines indicators from four different dimensions: trend, momentum, volume, and candlestick patterns, forming a relatively comprehensive signal confirmation system that reduces the generation of false signals.
-
Clear Risk Management: The strategy implements risk control based on account proportion, ensuring that single trade losses do not exceed 2% of account equity, which is crucial for long-term trading.
-
Adaptive Volatility Adjustment: By adjusting entry conditions and stop-loss/take-profit positions through the ATR indicator, the strategy can adapt to volatility changes in different market environments, showing good adaptability.
-
Trend Following Characteristics: The core design of the strategy is based on trend following concepts, confirming long-term trend direction through the EMA system and seeking entry opportunities in the trend direction, helping to capture major trend movements.
-
Visual Feedback: The strategy draws entry signals, stop-loss lines, and take-profit lines on the chart, providing intuitive visual feedback that facilitates monitoring and analysis by traders.
Strategy Risks
-
Inherent Lag: Although the strategy uses multiple indicators for confirmation, all indicators are essentially lagging indicators, which may lead to erroneous signals near market turning points. The solution is to consider adding some forward-looking indicators or temporarily suspending trading during extreme market volatility conditions.
-
Parameter Sensitivity: The strategy uses multiple fixed parameters (such as EMA10, EMA50, EMA100, ATR10, etc.), which may need adjustment in different market environments or for different trading instruments. It is recommended to validate strategy performance under different parameter settings through backtesting to find more robust parameter combinations.
-
Signal Scarcity: Since the strategy requires four conditions to be met simultaneously to generate a signal, it may lead to relatively scarce trading signals, missing some potential opportunities. Traders may consider appropriately relaxing certain conditions or adding alternative entry conditions.
-
Fixed Take-Profit Ratio: The strategy uses a fixed 3 times ATR as the take-profit target, which may not be suitable for all market environments. In strong trends, it may lead to early profit-taking, missing further upside. Consider implementing a dynamic take-profit mechanism or partial profit-taking strategy.
-
Unidirectional Trading Limitation: The current strategy only implements long trading logic, unable to profit in declining markets. A complete trading system should consider adding short selling logic to adapt to different market environments.
Strategy Optimization Directions
-
Add Partial Profit-Taking Mechanism: The current strategy adopts an all-or-nothing approach to take-profit or stop-loss. Consider implementing a partial profit-taking mechanism, for example, taking profit on 1/3 of the position at 1x ATR, another 1/3 at 2x ATR, and the remaining position at 3x ATR, which can lock in partial profits while preserving upside potential.
-
Introduce Trend Strength Filtering: Consider adding trend strength indicators (such as ADX or moving average slope) to filter signals in weak trend environments, only considering entry when trend strength reaches a certain threshold, improving signal quality.
-
Add Time Filters: Consider adding trading time filtering functionality to avoid major economic data releases or specific inefficient trading sessions, reducing noise interference.
-
Dynamically Adjust Risk Parameters: Based on market volatility or account performance, dynamically adjust risk proportions, for example, appropriately increasing risk exposure after consecutive profits and reducing risk exposure after experiencing losses.
-
Add Short Selling Logic: Implement complete short selling trading logic to make the strategy equally effective in declining markets, forming a trading system adaptable to all market conditions.
-
Add Market Environment Filtering: Incorporate market environment assessment mechanisms, such as those based on the VIX index or market breadth indicators, to pause trading or adjust parameters in market environments unsuitable for trend strategies.
Summary
The Trend Momentum Penetration Indicator Trading Strategy is a quantitative trading system based on multi-dimensional technical indicators, using moving average systems, ATR volatility, candlestick patterns, and volume confirmation to identify potential market opportunities. Its main advantages lie in the comprehensiveness of signal confirmation and the built-in risk management mechanism, which enable it to perform well in markets with clear trends.
However, the strategy also has limitations such as parameter sensitivity, signal lag, and unidirectional trading. By implementing partial profit-taking, adding trend strength filtering, incorporating market environment assessment, and adding short selling logic, the adaptability and robustness of the strategy can be further enhanced.
For traders, understanding the principles and limitations of the strategy is more important than blind application. Reasonable parameter adjustment, thorough backtesting validation, and judgment of market environment will help traders better apply this strategy. Ultimately, any trading strategy should be a component in a trader's toolbox rather than the sole means relied upon independently.
- 1