Volatility Directional Bias Quantitative Trading Model

Overview
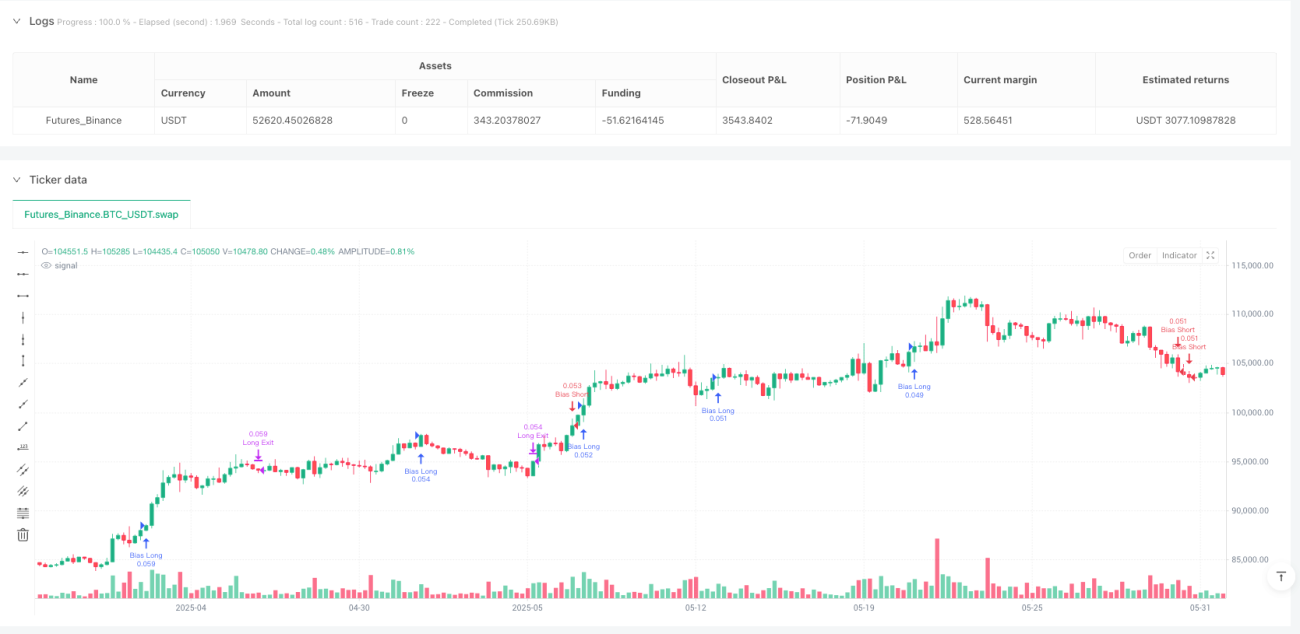
The Volatility Directional Bias Quantitative Trading Model is a purely mathematical, non-indicator-based trading system that detects directional probability shifts during high volatility market phases. Rather than relying on traditional technical indicators like Relative Strength Index (RSI) or moving averages, this strategy utilizes raw price behavior and clustering logic to determine potential breakout direction based on recent market bias. This approach employs statistical analysis to detect directional trends in the market and enters positions when volatility conditions are met.
Strategy Principles
The core principle of this strategy is built on two key factors: price directional consistency and market volatility. Over a defined lookback window (default 10 bars), the strategy counts how many candles closed in the same direction (i.e., bullish or bearish). Simultaneously, it calculates the price range during that window to measure market volatility.
The strategy opens positions when the following conditions are met:
- Market volatility is above a minimum threshold (default 0.05%)
- A clear directional bias is detected (e.g., >60% of closes are in the same direction)
This approach is based on the assumption that when high volatility is coupled with directional closing consistency, the market is probabilistically more likely to continue in that direction. The strategy applies ATR-based stop-loss and take-profit levels, and trades auto-exit after 20 bars if targets are not hit.
The strategy also includes several key parameters:
- Bias Window (10 bars): Number of past candles used to evaluate directional closings
- Bias Threshold (0.60): Required ratio of same-direction candles to consider a bias valid
- Minimum Range (0.05%): Ensures the market is volatile enough to avoid noise
- ATR Length (14): Used to dynamically define stop-loss and target zones
- Risk-Reward Ratio (2.0): Take-profit is set at twice the stop-loss distance
- Max Holding Bars (20): Trades are closed automatically after 20 bars to prevent stagnation
Strategy Advantages
Through deep analysis of this strategy's code, we can summarize the following significant advantages:
-
Pure Mathematical Approach: The strategy is entirely based on statistical inference rather than traditional indicators, reducing the risk of lagging signals and overfitting.
-
High Adaptability: By capturing actual price structures and volatility patterns in the market, the strategy can adapt to different market environments.
-
Multi-Timeframe Compatibility: The strategy can operate across various timeframes (1H, 4H, daily, etc.), providing flexible trading opportunities.
-
Dynamic Risk Management: Using ATR for stop-loss and take-profit settings ensures risk management automatically adjusts according to current market volatility.
-
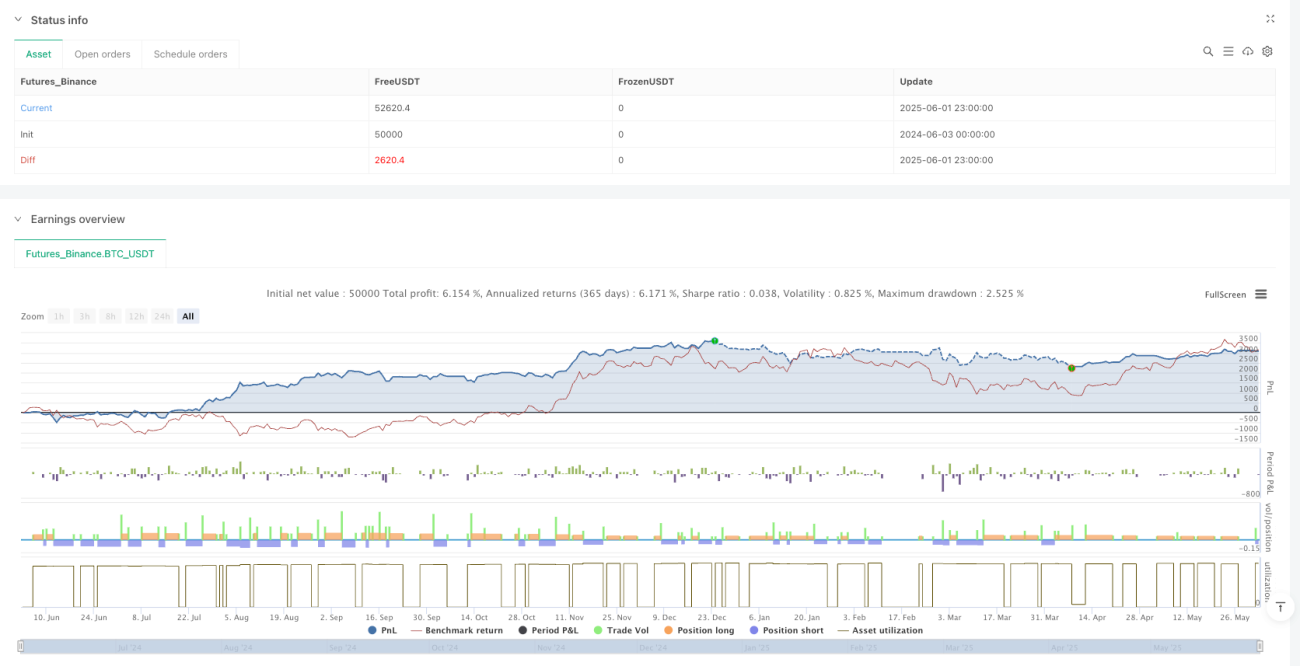
Realistic Trading Conditions: The strategy considers 0.05% trading commission, 1-point slippage on every entry and exit, and position sizing at 10% of a $10,000 starting capital, making backtest results closer to real trading environments.
-
No Pyramiding: Disabling the pyramiding feature avoids excessive concentration of risk.
-
Automatic Exit Mechanism: If trades don't reach targets within the predetermined time, they are automatically closed, preventing capital from being tied up indefinitely.
Strategy Risks
Despite its multiple advantages, the following potential risks exist in practical application:
-
False Breakout Risk: In highly volatile markets, prices may show directional bias but quickly reverse, leading to false signals. Solution: Consider adding confirmation indicators or extending confirmation time.
-
Parameter Sensitivity: The strategy's performance is highly dependent on parameter settings such as bias threshold and minimum volatility range. Small changes in these parameters may result in significantly different outcomes. Solution: Conduct comprehensive parameter optimization and robustness testing.
-
Inconsistent Performance Across Market Cycles: The strategy may perform inconsistently in different market cycles (trending vs. ranging markets). Solution: Add market environment filters to enable the strategy only under suitable market conditions.
-
Fixed-Time Exit Limitation: The forced exit after 20 bars may prematurely end potentially favorable trades in some situations. Solution: Implement smarter exit rules based on market conditions rather than fixed periods.
-
Fixed Risk-Reward Ratio: The fixed risk-reward ratio (2.0) may not be suitable for all market conditions. Solution: Dynamically adjust the risk-reward ratio based on volatility and market structure.
Strategy Optimization Directions
Through in-depth code analysis, I recommend the following optimization directions:
-
Market State Classification: Add a market state recognition mechanism to distinguish between trending and ranging markets, and adjust strategy parameters according to different market states. This can avoid generating false signals under unsuitable market conditions.
-
Dynamic Bias Threshold: The strategy currently uses a fixed bias threshold (0.60). Consider dynamically adjusting this threshold based on market volatility. During high volatility periods, a higher threshold may be needed to confirm genuine breakouts.
-
Multi-Timeframe Confirmation: Introduce multi-timeframe analysis to ensure trading direction aligns with longer-term market trends, reducing the risk of counter-trend trading.
-
Intelligent Exit Mechanism: Replace the fixed bar count exit rule with dynamic exit logic based on market conditions, such as using volatility changes, momentum weakening, or price structure changes as exit triggers.
-
Position Sizing Optimization: The strategy currently uses a fixed 10% position size. Implement risk-based position management, adjusting position size for each trade based on ATR and account risk tolerance.
-
Machine Learning Enhancement: Consider introducing machine learning algorithms to optimize bias detection and prediction, particularly using clustering or classification algorithms to identify more complex price patterns.
Summary
The Volatility Directional Bias Quantitative Trading Model is an innovative, statistically-based trading strategy that abandons reliance on traditional technical indicators in favor of utilizing raw price behavior and directional bias to identify trading opportunities. By combining volatility filtering with directional detection, the strategy can capture probability shifts in high-volatility markets, thereby gaining potential trading advantages.
The strategy's main strengths lie in its pure mathematical approach, high adaptability, and dynamic risk management, but it also faces challenges such as false breakout risk and parameter sensitivity. By implementing the suggested optimization measures, such as market state classification, dynamic bias thresholds, and intelligent exit mechanisms, the strategy's robustness and performance can be further enhanced.
Ultimately, this quantitative trading model represents an approach that moves away from traditional indicator dependence, focusing instead on the inherent statistical properties of the market, providing traders with an alternative, data-driven trading perspective. Nevertheless, any trading strategy should be considered for educational and experimental purposes and must be thoroughly tested and validated before being considered for actual trading.
- 1