Ehlers Three-Pole Butterworth Filter Crossover Trend Quantitative Trading Strategy

Overview
The Ehlers Three-Pole Butterworth Filter Crossover Trend Quantitative Trading Strategy is a technical analysis method based on signal processing theory, applying John Ehlers' three-pole Butterworth filtering algorithm to financial market data. This strategy smooths price fluctuations through filtering, identifies potential market trends, and generates trading signals using crossover points between filter values and trigger values. Additionally, the strategy integrates divergence detection mechanisms to capture regular and hidden bullish and bearish market signals, improving the accuracy of trading decisions. The core advantage of this strategy lies in effectively reducing market noise, enhancing trend identification reliability, and controlling trading risk through precise entry and exit points.
Strategy Principles
The core of the Ehlers Three-Pole Butterworth Filter Crossover Trend Quantitative Trading Strategy lies in its unique mathematical model. The Butterworth filter is a low-pass filter widely used in signal processing, characterized by its maximally flat amplitude response in the passband. In financial markets, this feature allows it to effectively filter short-term price fluctuations while preserving long-term trend information.
The implementation of this strategy is based on the following steps:
-
Filter Calculation: The three-pole Butterworth filter values are calculated through the
calculateButterworthFilterfunction. This function uses mathematical formulas to convert raw price data into smoothed filter values and corresponding trigger values. The filtering calculation involves complex mathematical operations, including exponential functions, trigonometric functions, and recursive calculations. -
Signal Generation: The strategy generates trading signals primarily through two methods:
- Crossover Signals: When the filter value crosses above the trigger value, a long signal is generated; when the filter value crosses below the trigger value, a short signal is generated.
- Divergence Detection: Identifies situations where price trends are inconsistent with indicator trends, including regular and hidden divergences, which typically suggest potential trend reversals.
-
Trade Execution: Based on the generated signals, corresponding trading operations are executed:
- When a long signal appears, the strategy enters a long position.
- When a long exit signal appears, the strategy closes the long position.
- When a short signal appears, the strategy enters a short position.
- When a short exit signal appears, the strategy closes the short position.
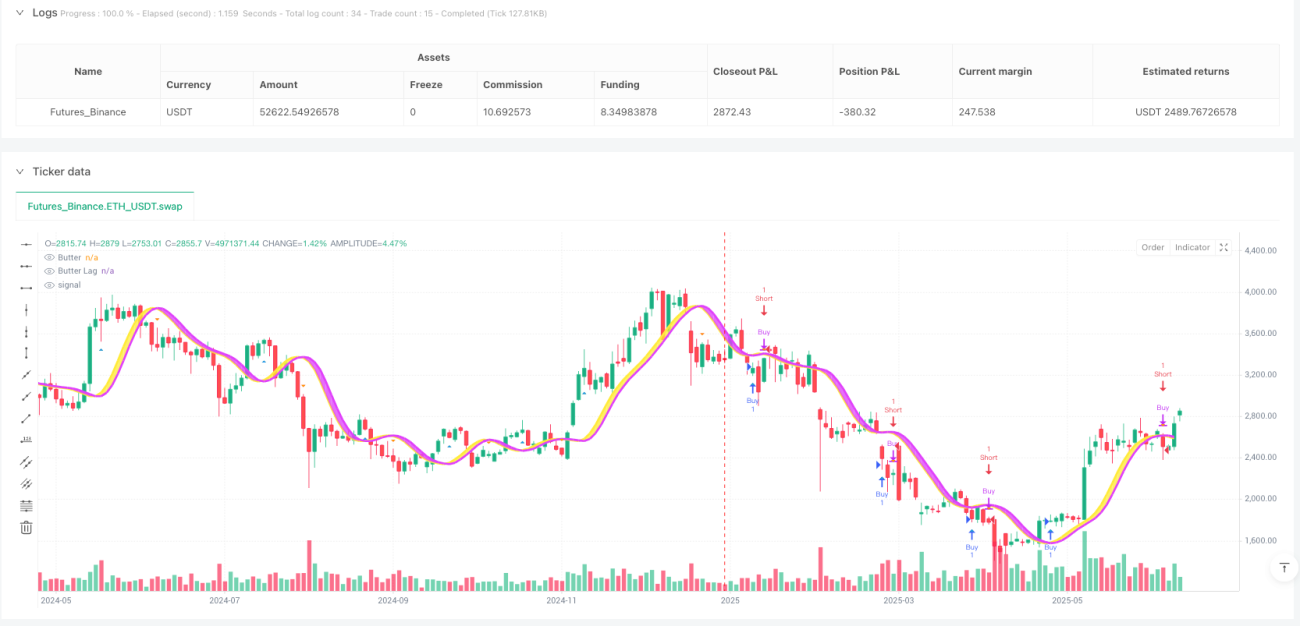
In the code, the strategy uses the strategy.entry and strategy.close functions to execute trading operations and visualizes trading signal points on the chart through the plotshape function.
Strategy Advantages
The Ehlers Three-Pole Butterworth Filter Crossover Trend Quantitative Trading Strategy offers several significant advantages:
-
Powerful Noise Filtering Capability: The three-pole Butterworth filter possesses excellent signal smoothing ability, effectively filtering short-term market fluctuations and false signals, making it easier for traders to identify genuine market trends. This efficient filtering is achieved through precisely calculated coefficients (coef1 to coef4) in the code.
-
Precise Trend Identification: The crossover between the filter and trigger lines provides clear signals of trend changes, allowing traders to capture key turning points in market trends in a timely manner. Through the
ta.crossoverandta.crossunderfunctions, the strategy precisely identifies these critical crossover points. -
Visual Intuitiveness: The strategy uses different colored lines and filled areas on the chart to visually display the relationship between filter values and trigger values, facilitating quick assessment of current market conditions. Yellow indicates bullish trends, while purple indicates bearish trends.
-
Flexibility: The strategy provides options for customizing price inputs and period parameters, allowing traders to adjust strategy parameters according to different market environments and personal preferences.
-
Complete Trading System: The strategy not only includes signal generation mechanisms but also integrates complete trading logic, including entry and exit rules, making it an independently usable trading system.
-
Signal Visualization: Through the
plotshapefunction, the strategy marks buy and sell signal points on the chart, allowing traders to intuitively understand historical signal performance, facilitating strategy evaluation and optimization.
Risk Analysis
Despite the many advantages of the Ehlers Three-Pole Butterworth Filter Crossover Trend Quantitative Trading Strategy, there are still some potential risks:
-
Lag Risk: As a filter indicator, this strategy inevitably has some lag. Although the three-pole Butterworth filter has less lag compared to simple moving averages, in rapidly changing markets, signals may still appear later than ideal entry points. To reduce this risk, consider shortening the period parameter, but this may also lead to excessive signal sensitivity.
-
False Signal Risk: In oscillating markets or markets without clear trends, the strategy may produce numerous false signals, resulting in frequent trading and unnecessary transaction fee losses. This risk can be mitigated by adding additional filtering conditions or combining with other indicators for confirmation.
-
Parameter Sensitivity: Strategy performance is highly dependent on the choice of period parameters. Different market environments may require different parameter settings, and incorrect parameter choices may lead to poor strategy performance. It is recommended to optimize parameters for different market environments through historical backtesting.
-
Single Indicator Risk: Relying on a single indicator for trading decisions may lead to poor performance in certain specific market environments. It is recommended to use this strategy as part of a trading system, combining it with other indicators or methods for comprehensive judgment.
-
Systemic Risk: In extreme market conditions, such as severe volatility or liquidity drought, any technical indicator based on historical data may fail. It is recommended to set appropriate risk control measures, such as stop-loss orders and position size management.
Optimization Directions
Based on an in-depth analysis of the Ehlers Three-Pole Butterworth Filter Crossover Trend Quantitative Trading Strategy, here are several possible optimization directions:
-
Adaptive Parameter Design: The current strategy uses fixed period parameters. Consider implementing an adaptive parameter mechanism that automatically adjusts period parameters based on market volatility. For example, by calculating the Average True Range (ATR) of prices to dynamically adjust period parameters, using shorter periods in high-volatility markets and longer periods in low-volatility markets.
-
Multi-Period Confirmation: Introduce filter calculations across multiple time periods, requiring signal consistency confirmation across different time periods to reduce false signals. Code could be added as follows:
[butterLong, triggerLong] = calculateButterworthFilter(priceInput, periodInput * 2) longConfirmation = butter > trigger and butterLong > triggerLong -
Add Auxiliary Indicators: Integrate other technical indicators as signal filters, such as Relative Strength Index (RSI), Stochastic, or volume indicators, executing trades only when confirmed by auxiliary indicators.
-
Risk Management Enhancement: Add dynamic stop-loss and take-profit mechanisms to the strategy, automatically adjusting stop-loss distances based on market volatility. Additionally, implement position size calculations based on money management principles.
-
Optimize Divergence Detection: The current code mentions divergence detection but does not elaborate on its implementation. Improve the divergence detection algorithm, especially for identifying hidden divergences, to further enhance signal quality.
-
Market Environment Filtering: Add market environment recognition mechanisms to use different trading rules in different market environments. For example, use long-period trend indicators to determine whether the current market is trending or oscillating, and adjust the trading strategy accordingly.
-
Machine Learning Enhancement: Consider introducing machine learning methods, such as classification algorithms or reinforcement learning, to optimize parameter selection and signal generation processes, improving the adaptive capacity of the strategy.
Summary
The Ehlers Three-Pole Butterworth Filter Crossover Trend Quantitative Trading Strategy combines signal processing theory with technical analysis, providing a scientific and systematic method for market trend identification. Through advanced filtering algorithms, this strategy reduces market noise and captures key turning points in price trends, providing objective and quantifiable bases for trading decisions.
The core advantages of the strategy lie in its powerful noise filtering capability and precise trend identification function, making it excel in markets with clear trends. At the same time, by providing visualized trading signals and flexible parameter adjustment options, the strategy meets the personalized needs of different traders.
However, like all technical indicators, this strategy also faces challenges such as lag, false signals, and parameter sensitivity. By implementing optimization measures such as adaptive parameter design, multi-period confirmation, and auxiliary indicator integration, the robustness and adaptability of the strategy can be further enhanced.
Ultimately, the Ehlers Three-Pole Butterworth Filter Crossover Trend Quantitative Trading Strategy provides quantitative traders with a trading tool based on solid mathematical foundations. It can be used either as an independent trading system or as a component of more complex trading strategies, providing valuable reference information for trading decisions. Through continuous optimization and improvement, this strategy has the potential to achieve stable and sustainable trading performance in various market environments.
- 1