Multi-Period ATR Adaptive SuperTrend Trading System

Overview
The Multi-Period ATR Adaptive SuperTrend Trading System is an intelligent trend-following strategy based on the Average True Range (ATR) indicator. This strategy utilizes changes in the SuperTrend indicator to identify market trend transition points and automatically executes long and short trades after trend confirmation. The system integrates independent take-profit parameters for both long and short positions and can close positions in real-time based on trend reversal signals, effectively improving win rates and capital efficiency.
Strategy Principles
The core of this strategy is based on the calculation logic and signal generation mechanism of the SuperTrend indicator. The SuperTrend indicator forms dynamic support and resistance levels by calculating the relationship between price and ATR. The specific implementation steps are as follows:
-
ATR Calculation: The strategy provides two ATR calculation methods - standard ATR calculation and TR calculation based on Simple Moving Average (SMA). Users can choose the calculation method that better suits the current market environment.
-
Upper and Lower Band Determination:
- Upper Band = Price Source - ATR Multiplier × ATR Value
- Lower Band = Price Source + ATR Multiplier × ATR Value
-
Trend Determination Logic:
- When the closing price breaks above the lower band, the trend turns upward (value 1)
- When the closing price breaks below the upper band, the trend turns downward (value -1)
-
Trade Signal Generation:
- Buy Signal: Trend changes from -1 to 1
- Sell Signal: Trend changes from 1 to -1
-
Intelligent Position Management: The strategy automatically cancels all pending orders before executing new trades to ensure new signals can be executed smoothly. The system also determines whether a reverse trade is needed based on the current position direction.
-
Risk Control Mechanism: The strategy sets independent take-profit parameters for long and short directions and uses a unified percentage stop-loss to control risk. Additionally, when the trend reverses, the system automatically closes positions to avoid larger losses.
Strategy Advantages
Through in-depth code analysis, this strategy has the following significant advantages:
-
Adaptation to Market Volatility: By dynamically adjusting support and resistance levels through the ATR indicator, the strategy can adapt to different market volatility environments, reducing false signals.
-
Flexible Parameter Configuration: The system provides a rich set of adjustable parameters, including ATR period, ATR multiplier, data source selection, etc., allowing users to perform personalized optimization based on different trading instruments and timeframes.
-
Independent Take-Profit Settings for Long/Short: The strategy innovatively provides independent take-profit parameters for long and short directions, better aligning with the asymmetric nature of markets, allowing different profit targets for long and short directions.
-
Automatic Position Closing on Trend Reversal: The system automatically closes positions when trends reverse, without waiting for take-profit or stop-loss triggers, effectively protecting existing profits and reducing potential losses.
-
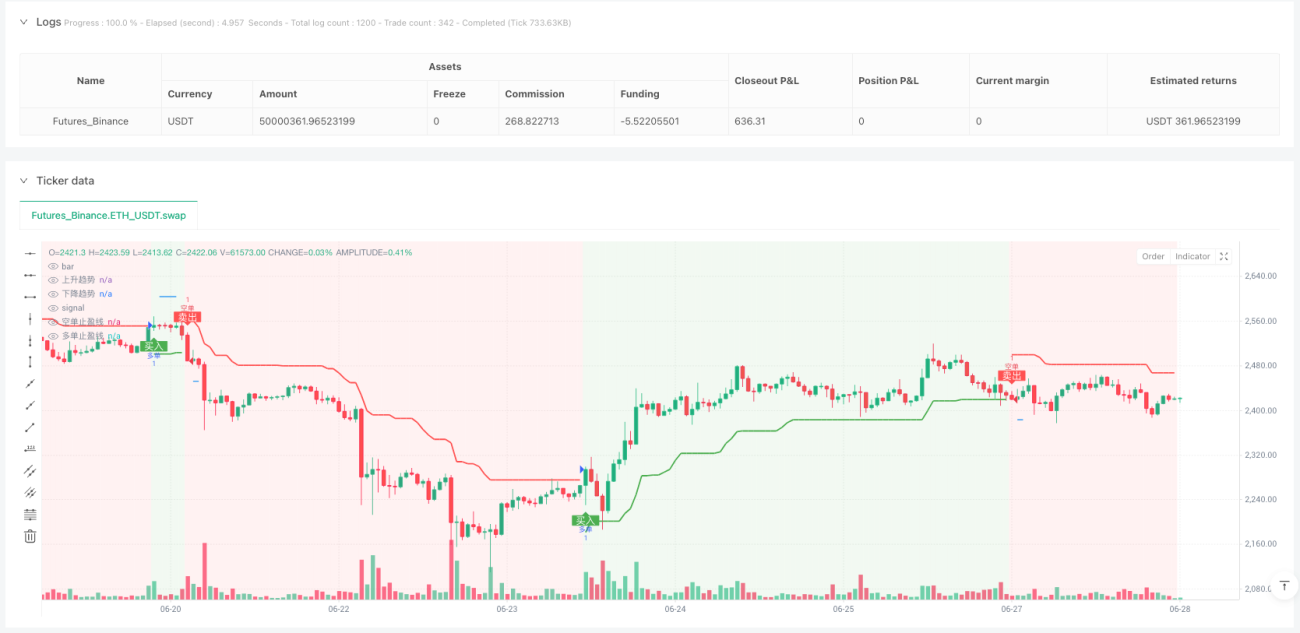
Visualization of Trading Signals: The strategy visually displays buy and sell signals, take-profit and stop-loss levels, and trend background colors on the chart, helping traders better understand and track the system's operating status.
-
Precise Signal Filtering: Through the trend confirmation mechanism, the strategy reduces false breakout signals in oscillating markets, improving trade quality.
Strategy Risks
Despite the strategy's excellent design, the following potential risks still exist:
-
Parameter Sensitivity: ATR multiplier and period settings significantly impact strategy performance, and inappropriate parameters may lead to overtrading or missing important signals. The solution is to find the optimal parameter combination through historical data backtesting.
-
Trend Reversal Risk: At strong trend transition points, the market may experience large gaps, causing stop-losses to fail to execute effectively. It is recommended to adjust the ATR multiplier or add additional market volatility filtering conditions in high-volatility market environments.
-
Single Indicator Dependency: The strategy mainly relies on the SuperTrend indicator without other auxiliary indicators for confirmation, which may generate incorrect signals in certain market environments. Consider adding other indicators for signal confirmation.
-
Fixed Percentage Stop-Loss: The strategy uses a fixed percentage to set stop-losses without considering current market volatility, which may place stop-loss levels too close in high-volatility environments. Consider dynamically linking stop-loss levels with ATR values.
-
Continuous Signal Processing: In oscillating markets, frequent trend transitions may occur, leading to overtrading and increased costs. Signal filtering mechanisms or time interval restrictions can be added to reduce trading frequency.
Strategy Optimization Directions
Based on code analysis, the strategy can be optimized in the following directions:
-
Add Volume Confirmation: Combine volume indicators to confirm the validity of trend changes, executing trade signals only when volume increases, which can effectively reduce losses from false breakouts.
-
Multi-Timeframe Analysis: Introduce a multi-timeframe analysis framework, trading only in the direction of larger timeframe trends, which can significantly improve system win rates. For example, execute hourly long signals only when the daily trend is upward.
-
Dynamic ATR Multiplier: Dynamically adjust the ATR multiplier based on market volatility states, using larger multipliers in high-volatility environments and smaller multipliers in low-volatility environments, making the system more adaptive.
-
Incorporate Market State Recognition: Develop a market state recognition module to distinguish between trending and oscillating markets, applying different trading strategies or parameter combinations in different market states.
-
Optimize Take-Profit and Stop-Loss Strategies: Implement dynamic trailing stops that automatically adjust stop-loss positions as prices move in favorable directions, both protecting profits and giving prices enough breathing room.
-
Add Trading Time Filters: Add specific trading session filters to avoid periods of high market volatility or poor liquidity, improving trade quality.
-
Capital Management Optimization: Dynamically adjust position sizes based on signal strength and market volatility conditions, increasing positions on high-confidence signals and reducing positions on low-confidence signals.
Conclusion
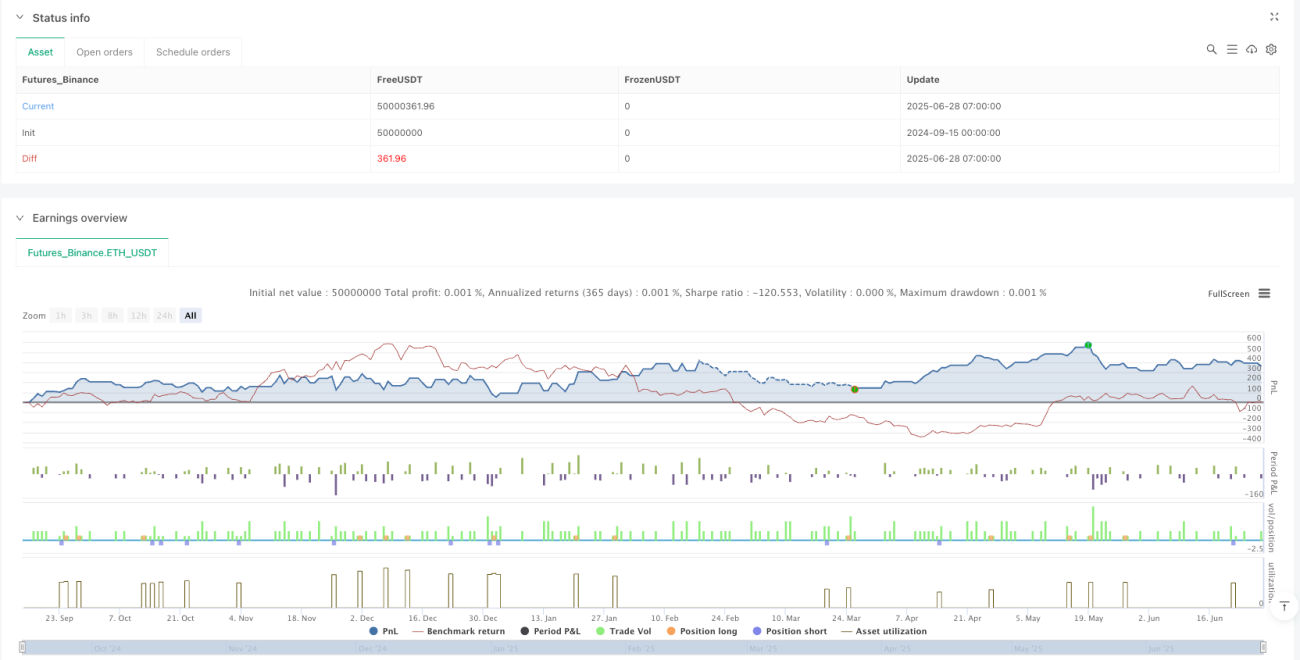
The Multi-Period ATR Adaptive SuperTrend Trading System is a comprehensive trend-following strategy that combines technical analysis and risk management. By utilizing the SuperTrend indicator to capture market trend transition points and employing flexible take-profit and stop-loss mechanisms, this strategy can maintain stable performance across various market environments.
The core advantages of this strategy lie in its adaptability and flexible parameter configuration, allowing it to adapt to different trading instruments and market cycles. By setting independent take-profit parameters for long and short directions, the strategy can better adapt to the asymmetric nature of markets, improving overall profitability.
Despite risks such as parameter sensitivity and single indicator dependency, through the suggested optimization directions, especially multi-timeframe analysis and dynamic ATR multiplier adjustments, this strategy has the potential to further enhance its stability and profitability. Ultimately, this strategy provides traders with a reliable, systematic trading framework that can help reduce emotional interference and achieve more objective and disciplined trade execution.
- 1