Enhanced Cloud Momentum Trend Following Strategy

I'll analyze the provided trading strategy code and create a comprehensive article in both Chinese and English according to your requirements.
Strategy Overview
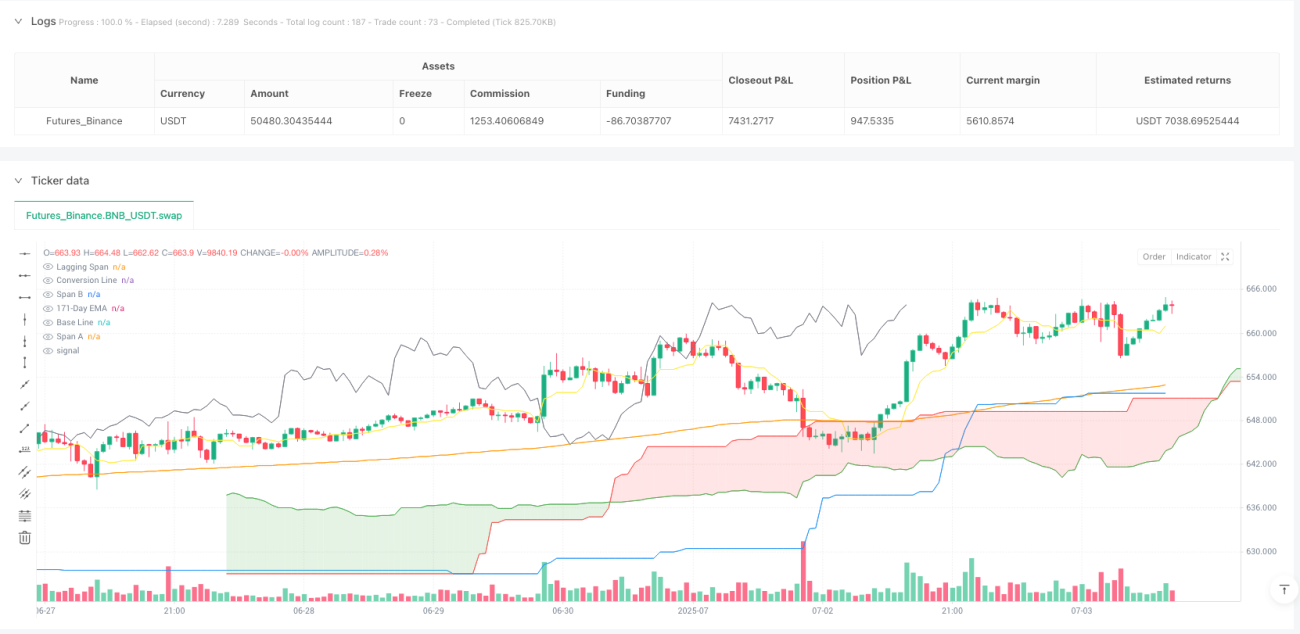
The Enhanced Cloud Momentum Trend Following Strategy is a powerful trend-following system that combines the Ichimoku Kinko Hyo system with a 171-period Exponential Moving Average (EMA) filter. This strategy is designed for traders looking to capture strong momentum moves while utilizing the cloud structure to identify optimal entry and exit points. It is a patient, low-frequency trading system that prioritizes quality over quantity. The strategy employs non-standard Ichimoku parameters (Conversion Line: 7 periods, Base Line: 211 periods, Lagging Span 2: 120 periods, Displacement: 41 periods) and combines them with a 171-period EMA as an additional trend confirmation layer, enabling precise capture of strong trends.
Strategy Principles
The core of this strategy lies in the synergistic action of carefully adjusted Ichimoku Cloud components and a long-term EMA filter:
-
Ichimoku Cloud Core Components:
- Conversion Line (Tenkan-sen): 7-period Donchian channel midpoint, more sensitive than the traditional 9-period
- Base Line (Kijun-sen): 211-period Donchian channel midpoint, providing stronger trend confirmation
- Span A (Senkou Span A): Average of Conversion and Base lines, projected 41 periods ahead
- Span B (Senkou Span B): 120-period Donchian channel midpoint, projected 41 periods ahead
- Lagging Span (Chikou Span): Current close plotted 41 periods back
-
Entry Logic (Default "Ichi" Mode):
A long position is triggered when ALL of the following conditions are met:- Cloud Bullish: Span A > Span B (41 periods ago)
- Breakout Confirmation: Current close > 25-period high
- Ichimoku Bullish: Conversion Line > Base Line
- Trend Alignment: Current close > 171-period EMA
- State Memory: No previous buy signal is still active
-
Exit Logic:
Positions are closed when Ichimoku turns bearish: Conversion Line < Base Line -
Alternative "Cloud" Mode:
- Entry: Span A crosses above Span B with additional cloud and EMA confirmations
- Exit: Span A crosses below Span B with cloud and EMA confirmations
-
State Memory System:
The strategy implements a sophisticated memory system to track buy/sell states and prevent false signals.
Strategy Advantages
-
High-Quality Signal Filtering:
The strategy's strict entry conditions ensure that it only enters the market when high-probability trends are forming, avoiding market noise and the cost losses associated with frequent trading. By requiring a bullish cloud, price breakout above the 25-period high, bullish Ichimoku, and price above the long-term EMA, the strategy effectively filters out weak signals. -
Multi-Layer Confirmation Mechanism:
Combining the Ichimoku Cloud system with the 171-period EMA provides multiple layers of trend confirmation, significantly reducing the risk of false breakouts and signals. This multi-filter mechanism is particularly suitable for capturing major trend movements. -
Flexible Trading Modes:
The strategy offers two trading modes ("Ichi" and "Cloud"), catering to different trader preferences and market condition requirements. This flexibility allows traders to adapt the strategy based on market characteristics. -
Robust State Memory System:
The implemented state memory system effectively prevents repeated triggering of consecutive signals, improving trading efficiency and reducing unnecessary trading costs. -
Optimized Parameter Settings:
The non-standard Ichimoku parameters (Conversion: 7, Base: 211, Lagging Span 2: 120, Displacement: 41) are optimized to better adapt to modern market conditions and specific asset price characteristics.
Strategy Risks
-
Lag Risk:
Like all Ichimoku strategies, signals may lag significant price moves. Especially in rapidly changing market environments, the strategy may miss optimal entry points or delay exits, resulting in reduced gains or increased losses. -
Choppy Market Risk:
While the strategy is designed for trending markets, it may generate false signals in sideways or choppy markets. Extended periods of price consolidation may lead to multiple entries and exits, causing "whipsaw" losses. -
Parameter Sensitivity:
The custom parameters used in the strategy may not be equally effective across all market conditions. Different market environments and assets may require different parameter settings, which necessitates continuous monitoring and adjustment by traders. -
Entry Delay:
The 25-period high breakout confirmation requirement may delay entries in fast-moving markets, causing the strategy to miss a portion of the initial price movement. -
Money Management Risk:
The strategy uses a default 100% equity allocation, which may be too aggressive for actual trading. The lack of proper position sizing control may lead to excessive risk exposure.
Optimization Directions
-
Dynamic Parameter Adjustment:
Implement an adaptive parameter system that automatically adjusts Ichimoku periods and EMA length based on market volatility and current trend strength. For example, shortening the Conversion Line period in high volatility markets and extending it in low volatility markets. This would improve the strategy's adaptability across different market conditions. -
Improved Money Management:
Introduce a more sophisticated money management system that dynamically adjusts position size based on market volatility, current trend strength, and risk metrics. For instance, position size could be adjusted according to ATR (Average True Range) or cloud thickness, increasing positions in strong trends and reducing them in weak trends. -
Add Risk Control Mechanisms:
Implement stop-loss and profit target settings that can be automatically set based on cloud structure, key support/resistance levels, or volatility indicators. For example, using the bottom of the cloud as a stop-loss point for long positions, or using multiples of ATR to set trailing stops. -
Optimize Short-Term Trading Capability:
The current strategy is primarily aimed at long-term trends. Adding short-term indicators (such as RSI or stochastic) could improve performance in short-term market conditions. This would enable the strategy to profit even when trends are not obvious. -
Add Market State Classification:
Add a market state recognition system that automatically distinguishes between trending and ranging markets, and applies different trading rules based on different market states. For example, raising entry thresholds or avoiding trading altogether when a ranging market is identified.
Summary
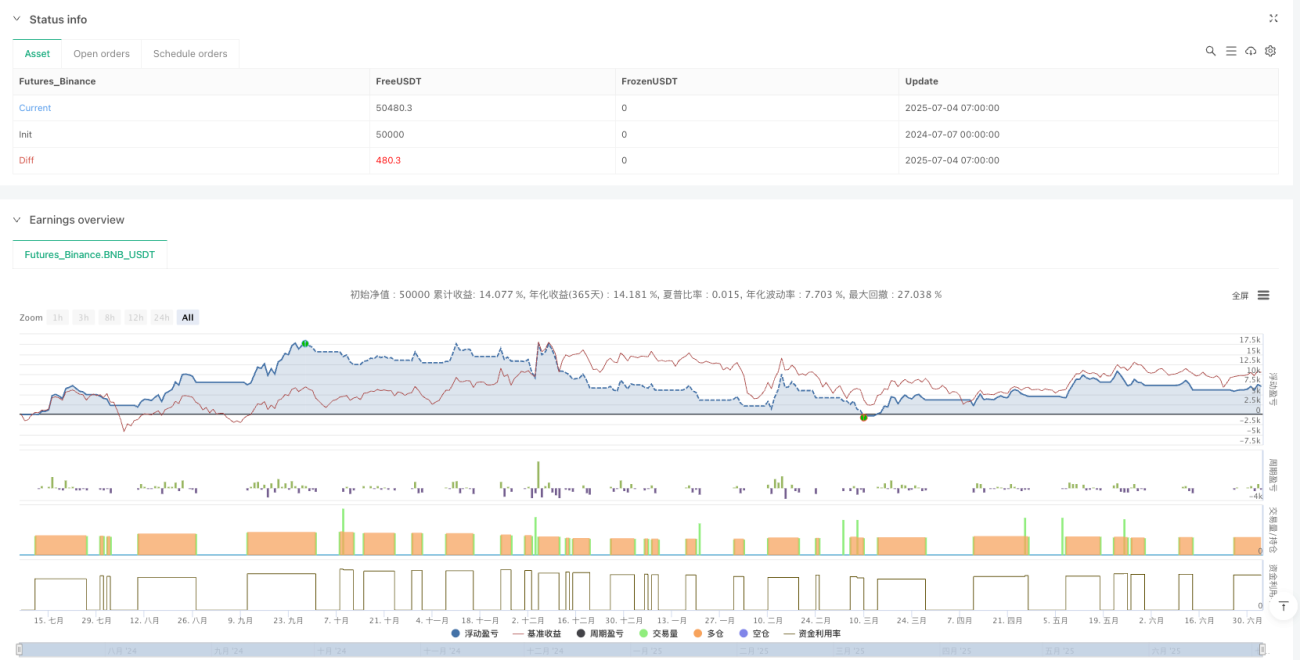
The Enhanced Cloud Momentum Trend Following Strategy is a meticulously designed trend-following system that combines customized Ichimoku Cloud parameters with a long-term EMA filter, providing traders with a powerful tool for capturing major trend movements. Through its multi-layer confirmation mechanism, state memory system, and strict entry conditions, the strategy effectively filters out market noise and identifies high-probability trading opportunities.
While the strategy excels in trending markets, traders should be aware of its potential limitations in choppy markets and its lagging signal characteristics. By introducing dynamic parameter adjustment, improved money management, enhanced risk control mechanisms, optimized short-term trading capability, and market state classification, the strategy can further enhance its adaptability and robustness across different market environments.
Most importantly, traders should optimize parameters and control position sizing according to their risk tolerance and specific asset characteristics when applying this strategy in practice, and combine it with other technical and fundamental analyses for comprehensive decision-making. The strategy provides a solid trend-following framework, but successful trading still requires discipline, patience, and continuous market observation.
/*backtest
start: 2024-07-07 00:00:00
end: 2025-07-04 08:00:00
period: 1h
basePeriod: 1h
exchanges: [{"eid":"Futures_Binance","currency":"BNB_USDT"}]
*/

//@version=6
//Quant Trading
strategy("Enhanced Ichimoku Cloud Strategy V1 [Quant Trading]", overlay=true,
default_qty_type=strategy.percent_of_equity,- 1