Adaptive Renko Momentum Trend Following Strategy with ADX Filter

Strategy Overview
The Adaptive Renko Momentum Trend Following Strategy is a trading system based on Renko charts and the UT Bot method, combining an adaptive ATR (Average True Range) trailing stop with an ADX (Average Directional Index) momentum filter. The strategy primarily triggers trading signals when price and EMA (Exponential Moving Average) cross the adaptive trailing stop line and ADX/DI+/DI- conditions are met. This combination is designed to help traders operate in strong trending markets while avoiding choppy, low-momentum market environments, thereby improving trading success rates.
The core logic revolves around a dynamically adjusting trailing stop line that automatically adapts to market volatility, providing clear entry signals for both long and short positions. Meanwhile, the ADX filter ensures trading only occurs when the market has sufficient directionality and momentum, significantly reducing the possibility of false signals in ranging markets.
Strategy Principles
The core principles of this strategy are based on several key components:
-
ATR Trailing Stop Line: Uses the ATR indicator to calculate volatility and applies a multiplier factor to create a dynamic stop line. This line can adaptively adjust according to market conditions, widening the stop distance when volatility increases and narrowing it when volatility decreases.
-
EMA and Stop Line Crossovers: When price and EMA cross the trailing stop line, potential trading signals are generated. Specifically, a buy signal is produced when the EMA crosses above the stop line, and a sell signal is produced when the stop line crosses above the EMA.
-
ADX Momentum Filter: Calculates ADX and its related indicators DI+ and DI- to evaluate market trend strength and direction. Trade signals are only confirmed when the ADX value exceeds a set threshold, and the corresponding directional indicator (DI+ for long trades, DI- for short trades) meets its condition.
-
Renko Chart Application: The strategy is specifically designed for Renko charts, leveraging their ability to filter market noise and provide clearer trend signals.
In its implementation, the strategy first calculates the ATR value, determining whether to use smoothing and adaptive multipliers based on settings. It then constructs the UT Bot trailing stop line, which dynamically adjusts according to price movement. Next, it calculates the EMA and detects crossovers with the stop line. Simultaneously, the strategy manually calculates ADX, DI+, and DI- indicators and sets filter conditions. Ultimately, actual trading signals are only triggered when price/EMA crossovers with the stop line occur and ADX filter conditions are satisfied.
Strategy Advantages
This strategy offers the following significant advantages:
-
Strong Adaptability: The stop line calculated through ATR can dynamically adjust according to market volatility, allowing the strategy to operate effectively in different market environments. The adaptive ATR multiplier option, in particular, enables automatic adjustment of stop distances based on changes in short-term volatility relative to long-term volatility.
-
Dual Trend Confirmation Mechanism: The combination of EMA crossovers and ADX filtering provides a dual verification mechanism for trend confirmation, significantly reducing the possibility of false breakouts and erroneous signals.
-
Avoids Low-Quality Markets: The ADX and directional indicator filters effectively avoid choppy, directionless market environments, allowing the strategy to focus on high-momentum, clearly directional trading opportunities.
-
Clear Visual Feedback: The strategy provides intuitive stop line displays and trade labels, allowing traders to clearly see entry points and stop loss positions, facilitating real-time decision-making and risk management.
-
Highly Customizable: The strategy offers multiple parameter setting options, including ATR period, multiplier, EMA period, ADX thresholds, etc., allowing traders to optimize and adjust according to personal preferences and different market characteristics.
-
Optimized for Renko Charts: The strategy is specifically designed for Renko charts, fully utilizing their characteristics of reducing noise and highlighting trends, which highly aligns with the strategy's trend-following nature.
Strategy Risks
Despite its sophisticated design, this strategy still presents the following potential risks:
-
Parameter Sensitivity: Strategy performance is highly dependent on parameter settings such as ATR period, multiplier, ADX threshold, etc. Inappropriate parameters may lead to excessive false signals or missed important trading opportunities. The solution is comprehensive backtesting and parameter optimization under different market conditions.
-
Trend Reversal Risk: Despite the ADX filter, the strategy may still incur losses when strong trends suddenly reverse. This risk can be mitigated by setting additional stop loss conditions or incorporating other reversal indicators.
-
Low Liquidity Market Risk: In low liquidity markets, price movements may be irregular, leading to inaccurate ATR calculations and trailing stop lines. It is recommended to apply this strategy in markets with adequate liquidity.
-
Market Intermittency: Markets frequently switch between trending and oscillating phases, and even with the ADX filter, false signals may occur during these transitions. Consider adding market structure analysis or time filters to optimize strategy performance.
-
Over-Optimization Risk: With multiple adjustable parameters, there is a risk of over-optimization, which may lead to poor strategy performance in actual trading. Walk-forward testing and out-of-sample testing are recommended to verify the robustness of the strategy.
Strategy Optimization Directions
Based on code analysis, this strategy can be optimized in the following directions:
-
Integrate Multi-Timeframe Analysis: Introducing trend confirmation from higher timeframes and only trading in the direction of larger trends can improve win rates. This can be implemented by adding long-period moving averages or other trend indicators.
-
Dynamically Adjust ADX Thresholds: The current ADX threshold is fixed; consider dynamically adjusting thresholds based on market volatility or cyclical characteristics to adapt to different market environments. For example, raise the ADX threshold in high volatility markets and lower it in low volatility markets.
-
Add Profit Targets and Stop Loss Management: The current strategy focuses on entry signals; consider adding ATR-based dynamic profit targets and more refined stop loss management, such as trailing stops or partial profit-taking strategies.
-
Integrate Volume-Price Relationship Analysis: Include volume analysis in signal confirmation, only trading when volume confirms the trend, which can further improve signal quality.
-
Seasonality and Time Filters: Add seasonality filters based on historical statistics or specific time period filters to avoid known inefficient trading periods.
-
Machine Learning Optimization: Use machine learning techniques to optimize parameter selection and signal confirmation processes, which can improve strategy adaptability and performance. This involves training models using historical data to predict optimal parameter combinations or directly predict signal reliability.
-
Improve Renko Settings: Explore different Renko brick sizes and construction methods to find the most suitable settings for specific markets. Consider using adaptive Renko brick sizes that dynamically adjust based on market volatility.
Summary
The Adaptive Renko Momentum Trend Following Strategy is a well-designed trading system combining various technical analysis tools and filtering methods. Through the combination of adaptive ATR trailing stops, EMA crossover signals, and ADX momentum filters, the strategy can effectively identify trading opportunities in strong trending markets while avoiding low-quality oscillating markets.
The strategy's main advantages lie in its adaptability and dual confirmation mechanism, allowing it to maintain relatively stable performance across different market environments. Additionally, through clear visual feedback and highly customizable parameter settings, traders can optimize and adjust according to personal preferences and specific market characteristics.
However, when using this strategy, attention must be paid to parameter sensitivity, trend reversal risks, and over-optimization issues. The strategy's performance can be further improved by adding multi-timeframe analysis, dynamically adjusting parameters, improving stop loss management, and integrating other analytical tools.
Overall, this is a trend-following strategy with solid theoretical foundations and reasonable design, particularly suitable for traders interested in Renko charts and momentum trading. Through a thorough understanding of the strategy principles and appropriate parameter optimization, it has the potential to become an effective tool in trading systems.
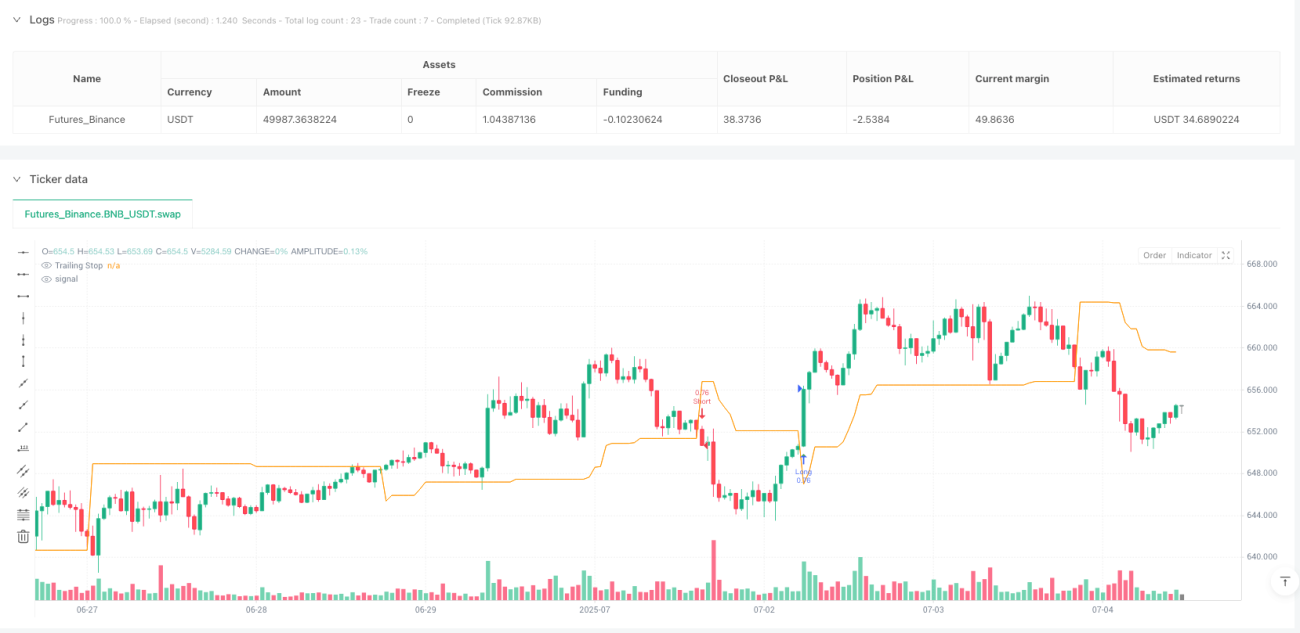
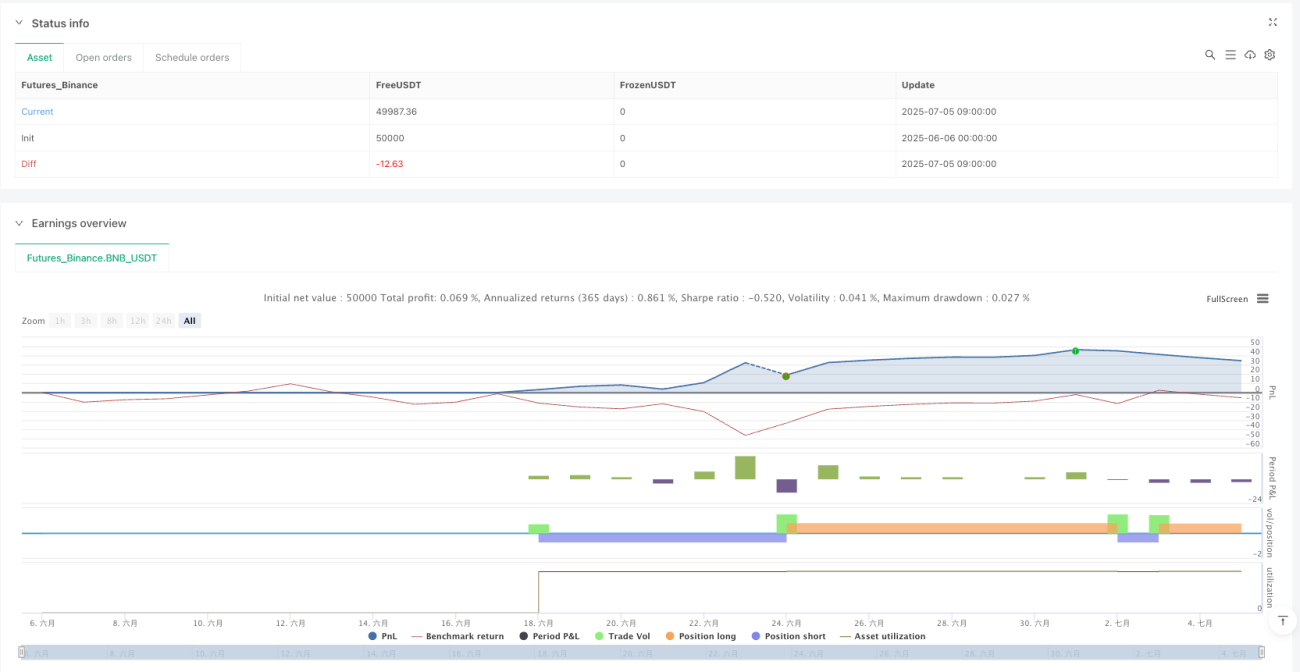
/*backtest
start: 2025-06-06 00:00:00
end: 2025-07-05 10:00:00
period: 1h
basePeriod: 1h
exchanges: [{"eid":"Futures_Binance","currency":"BNB_USDT"}]
*/

//@version=6
strategy("Renko UT Bot Strategy v6 - ADX Filter", overlay=true, default_qty_type=strategy.percent_of_equity, default_qty_value=1)

// === Inputs ===- 1