
Strategy Overview
This strategy ingeniously combines Volume-Weighted Moving Average (VWMA) with a Machine Learning enhanced Relative Strength Index (ML RSI) to create a high-probability trading system. The system leverages the relationship between price and volume along with machine learning optimized technical indicators to generate more precise trading signals when market trends are clear. The core logic includes: generating buy signals when price closes above VWMA and ML RSI is above 60; triggering sell signals when price closes below VWMA and ML RSI falls below 40. The system also incorporates a 1.5% take profit and stop loss mechanism to ensure effective risk management.
Strategy Principles
The core principles of this strategy are built on the synergistic action of two main technical indicators:
-
Volume-Weighted Moving Average (VWMA): Unlike traditional moving averages, VWMA considers the volume factor, giving greater weight to price during high-volume periods, thus more accurately reflecting market trends. In this strategy, VWMA serves as a key trend confirmation tool, with price above VWMA indicating a bullish trend, and vice versa.
-
Machine Learning Enhanced RSI (ML RSI): By combining traditional RSI with advanced smoothing techniques (such as ALMA, EMA, etc.), it reduces the noise of conventional RSI and improves responsiveness to price action. This indicator helps filter weak signals and improves trend confirmation. In particular, the strategy allows for the selection of multiple moving average types for RSI smoothing, including SMA, EMA, DEMA, TEMA, WMA, VWMA, SMMA, HMA, LSMA, and ALMA.
The buy logic incorporates a delayed confirmation mechanism: if only one condition is met (price above VWMA or ML RSI above 60), the system waits for the second condition to confirm before entering. This design significantly reduces false signals and improves trading success rates.
The sell logic is relatively strict: it requires price to close below VWMA and ML RSI to fall below 40, ensuring that only genuine trend reversals trigger exits, avoiding premature departure from positions.
Strategy Advantages
-
Comprehensive Signal Confirmation: Combines multi-dimensional analysis of price, volume, and technical indicators, reducing false signals that might arise from a single indicator.
-
Machine Learning Enhancement: The RSI optimized through various smoothing techniques provides more stable, less noisy signals, particularly with the application of advanced algorithms like ALMA (Arnaud Legoux Moving Average), significantly improving signal quality.
-
Flexible Parameter Configuration: The strategy allows adjustment of VWMA length, ML RSI smoothing method, ALMA sigma value, and entry/exit RSI thresholds, enabling traders to optimize strategy performance for different market environments.
-
Clear Risk Management: Built-in 1.5% take profit and stop loss mechanisms ensure controllable risk for each trade, preventing excessive losses from single trades.
-
Dual Confirmation Mechanism: Requiring both indicators to meet conditions simultaneously for trading signals greatly reduces the error rate.
-
Delayed Confirmation Design: For partially met conditions, the strategy waits until all conditions are satisfied before executing trades, further reducing unnecessary trading frequency and lowering transaction costs.
Strategy Risks
-
Lag Risk: Although ML RSI reduces noise through machine learning methods, VWMA as a moving average still has certain lag, potentially causing delayed signals in volatile markets. The solution is to adjust VWMA length according to market volatility, possibly shortening it during high volatility periods.
-
Parameter Optimization Trap: Excessive parameter optimization may lead to overfitting, resulting in poor performance in live trading. It's recommended to validate parameter robustness through forward testing or diverse test samples.
-
Fixed Take Profit/Stop Loss Limitations: The fixed 1.5% take profit/stop loss levels may not be suitable for all market environments, especially in highly volatile markets. Consider using ATR (Average True Range) to dynamically adjust stop loss levels.
-
Single Timeframe Limitation: The strategy runs on a single timeframe, potentially missing turning points in larger trends. Consider incorporating multi-timeframe analysis to enhance decision quality.
-
Fixed RSI Threshold Issue: The fixed RSI thresholds of 60 and 40 may not be flexible enough in different market environments. Consider using dynamic thresholds or adjusting thresholds based on historical volatility.
-
Sideways Market Risk: In sideways markets, price frequently crossing VWMA may trigger excessive trading, increasing costs. Additional filtering conditions, such as volatility indicators or trend strength confirmation, can be added.
Strategy Optimization Directions
-
Multi-Timeframe Analysis Integration: Introducing higher timeframe trend confirmation and only trading when the larger trend direction is consistent can significantly improve win rates. For example, adding a daily VWMA as a trend filter and only going long when the daily trend is up.
-
Dynamic Stop Loss Mechanism: Replacing fixed percentage stops with ATR (Average True Range) allows stop loss levels to automatically adjust according to market volatility, giving price more room during high volatility and protecting profits more tightly during low volatility.
-
Signal Strength Grading: Grading signal strength based on the distance between ML RSI and thresholds and the relationship between price and VWMA, then adjusting position size accordingly, achieves more refined capital management.
-
Market Environment Recognition: Adding volatility indicators (such as ATR or Bollinger Bandwidth) to identify market environments and applying different parameters or strategy variants in different environments.
-
Introducing Machine Learning for Parameter Optimization: Using machine learning techniques like genetic algorithms or Bayesian optimization to automatically adjust strategy parameters to adapt to different market environments, avoiding manual overfitting.
-
Improving ML RSI Algorithm: Trying more advanced smoothing algorithms or adding inputs from other technical indicators, such as volume or price volatility, to further enhance the predictive ability of ML RSI.
-
Adding Market Sentiment Indicators: Integrating market sentiment indicators like VIX or option implied volatility, adjusting strategy behavior during extreme market sentiment to avoid excessive trading in high-risk environments.
Summary
The dynamic trading system combining VWMA with machine learning enhanced RSI is an advanced quantitative trading strategy that combines traditional technical analysis with modern machine learning technology. By combining trend information provided by the volume-weighted moving average with momentum information provided by machine learning optimized RSI indicators, this strategy can generate high-quality trading signals when trends are clear.
The core advantages of the strategy lie in its multiple confirmation mechanisms and flexible parameter configuration, allowing it to adapt to different market environments. Meanwhile, the built-in risk management mechanisms ensure controllable risk for each trade. However, the strategy also faces risks such as lag and fixed parameter limitations, which need to be optimized through multi-timeframe analysis, dynamic stop loss mechanisms, and other approaches.
For quantitative traders, this strategy provides a powerful basic framework that can be further customized and optimized according to personal trading style and market preferences. By incorporating more advanced techniques and methods, such as multi-timeframe analysis and machine learning parameter optimization, this strategy has the potential to maintain stable performance across various market environments.
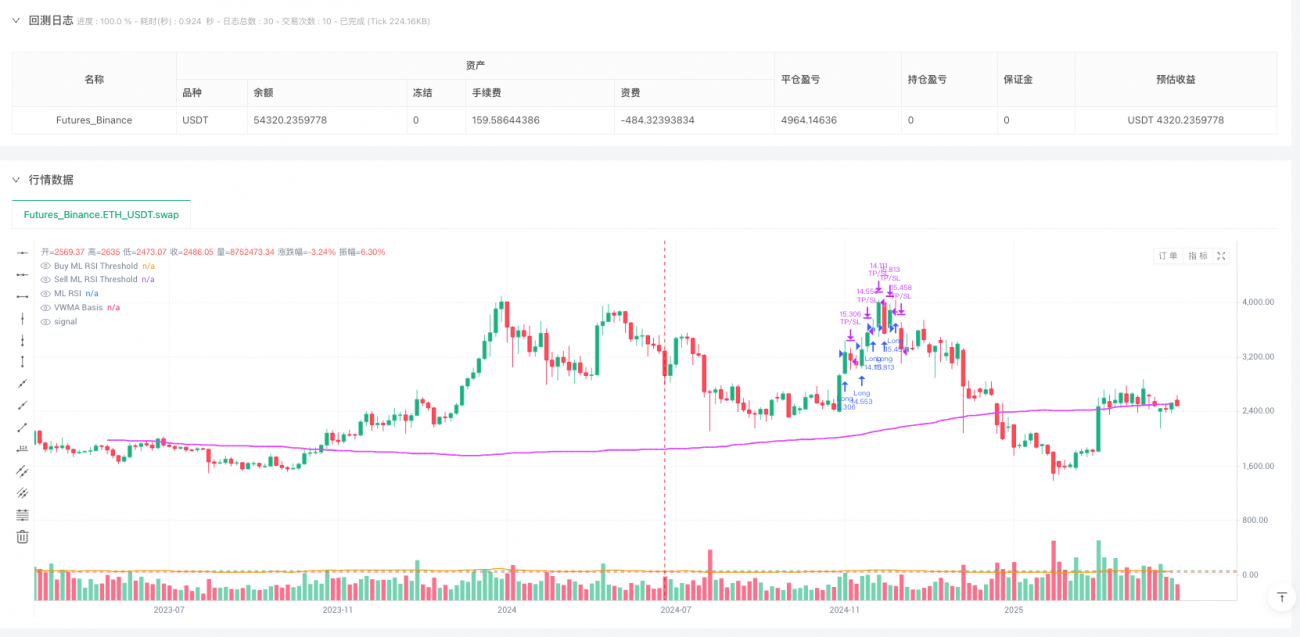
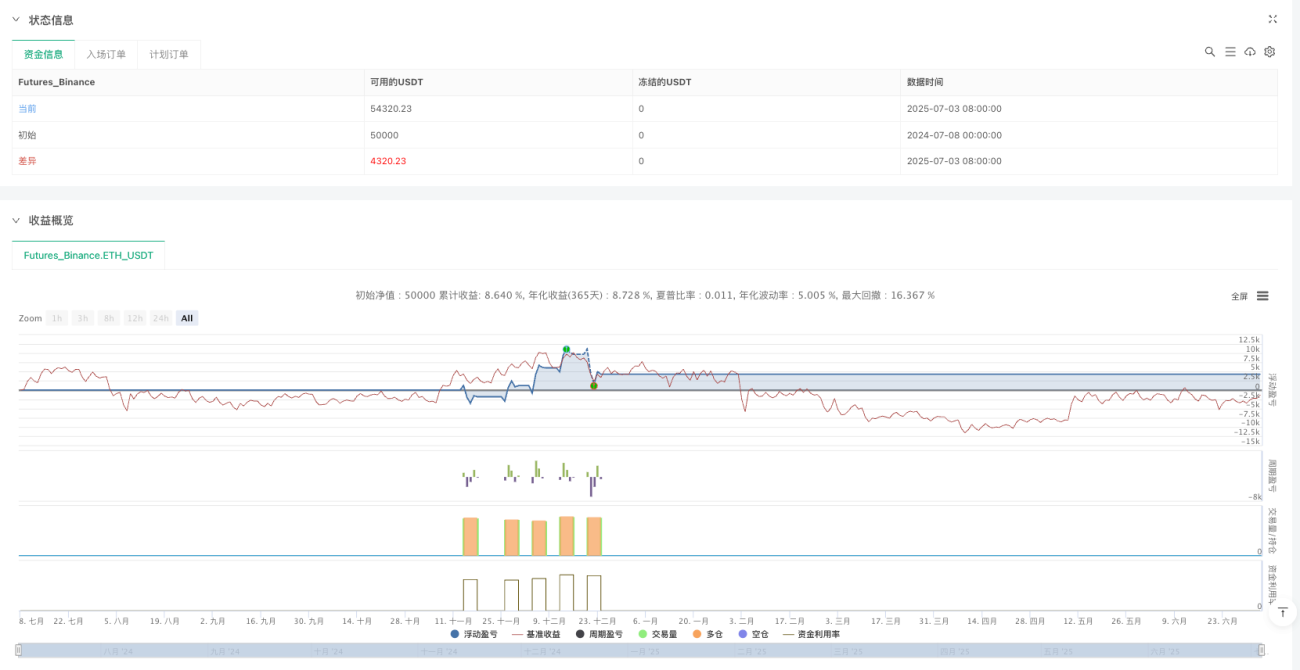
/*backtest
start: 2024-07-08 00:00:00
end: 2025-07-04 08:00:00
period: 4d
basePeriod: 4d
exchanges: [{"eid":"Futures_Binance","currency":"ETH_USDT"}]
*/

//@version=5
strategy("VWMA + ML RSI Strategy", overlay=true, default_qty_type=strategy.percent_of_equity, default_qty_value=100)

// === VWMA INPUTS ===- 1