High-Frequency Dip Buying Strategy Optimization in Bull Market Conditions

Overview
The High-Frequency Dip Buying Strategy is a technical indicator-based quantitative trading system specifically designed to capitalize on price retracements in bull market environments. This strategy is a comprehensive optimization and rewrite of the "Buy The Dips in Bull Market" strategy released by Coinrule in 2020, reconstructed using Pine Script v6. Through deep analysis of Bitcoin's hourly data spanning more than two years, the optimized version provides an additional 312.6% return compared to the original strategy, achieving a 74.8% win rate.
Core Philosophy: The strategy leverages temporary price dips in bull market environments, entering long positions when the RSI indicator shows oversold conditions while the market structure remains bullish, then exiting when prices recover above key moving averages.
Strategy Principles
The strategy employs a multi-condition judgment system, including the following core logic:
Entry Logic:
The strategy enters a long position when all of the following conditions are simultaneously met:
- RSI Oversold Condition: RSI indicator drops below the configurable threshold (default: 45)
- Bull Market Structure Confirmation: Long-term moving average (150-period) is below the medium-term moving average (40-period), indicating an overall bullish momentum
- Date Range: The trade occurs within the specified backtesting period
Exit Logic:
The strategy closes positions when both of the following conditions are met:
- Price Recovery: Current price moves above the fast moving average (15-period)
- MA Alignment: Fast moving average crosses above slow moving average, confirming trend continuation
Optional Short Trading:
When enabled, the strategy can also perform short trades using inverse logic:
- Short Entry: RSI overbought (above 55 by default) plus bearish market structure
- Short Exit: Price decline below fast MA, along with bearish MA alignment
Risk Management:
The strategy utilizes ATR-based stop-loss/take-profit settings, using volatility to dynamically determine risk levels. It employs a default 2:1 risk-reward ratio with fully customizable options. Additionally, it offers a fixed percentage-based risk management alternative.
Strategy Advantages
-
High Win Rate Performance:
Through optimized parameter settings, the strategy achieves a high win rate of 74.8%, which is very impressive for quantitative trading strategies. This high win rate results in a smoother equity curve, helping to reduce psychological pressure. -
Dynamic Risk Management:
The strategy employs an ATR-based stop-loss and take-profit mechanism that automatically adjusts risk levels according to market volatility. This approach is more scientific than fixed percentages and maintains consistent risk control in environments with different volatility levels. -
Optimized Parameter Combination:
- RSI Period: Increased to 14 (more reliable than the original version)
- RSI Buy Signal: Optimized to 45 (increased from 35), reducing false signals
- Fast MA: Shortened to 15 periods (from 9 periods), improving response speed
- Slow MA: Reduced to 40 periods (from 50 periods), enhancing trend detection
- Long MA: Reduced to 150 periods (from 200 periods), better identifying bull market structure
-
Bidirectional Trading Capability:
The strategy offers optional short trading functionality, allowing it to adapt to different market environments rather than being limited to unidirectional trading. -
Comprehensive Visualization:
The strategy provides enhanced charting functions, including risk level displays, helping traders intuitively understand trading logic and risk management.
Strategy Risks
-
Bull Market Dependency:
The strategy is specifically designed for bull market conditions and may significantly underperform in prolonged bear market environments. In unclear trend or sideways markets, the strategy may generate frequent false signals. -
Trend Following Characteristics:
As a trend-following strategy, it may experience significant drawdowns during strong trend reversals. Particularly when markets rapidly transition from bull to bear markets, the strategy may fail to adjust in time. -
High-Frequency Trading Challenges:
The strategy generates multiple signals requiring active monitoring, which may increase trading costs and operational complexity. High-frequency trading can lead to increased slippage and fees, affecting actual returns. -
Parameter Sensitivity:
Strategy performance is sensitive to parameter settings, and different markets and timeframes may require different parameter optimizations. Improper parameter selection may lead to overfitting or decreased signal quality. -
Risk Management Limitations:
While ATR risk management is a superior method, in extreme market conditions (such as flash crashes or gaps), stop-losses may not execute at expected prices, resulting in actual losses exceeding expectations.
Optimization Directions
-
Adaptive Parameter Adjustment:
Consider implementing an adaptive parameter system that automatically adjusts RSI thresholds and moving average periods based on market volatility and trend strength. For example, use lower RSI thresholds and longer moving average periods in high-volatility environments to reduce false signals. -
Market State Classification:
Add more sophisticated market state recognition algorithms to clearly distinguish between bull markets, bear markets, and sideways markets, applying different trading logic for different market states. Additional indicators such as ADX (Average Directional Index) can be introduced to measure trend strength. -
Machine Learning Optimization:
Utilize machine learning algorithms to automatically identify optimal parameter combinations, or even build dynamic prediction models to improve signal quality. This can be achieved through training on historical data and periodic retraining to adapt to market changes. -
Multi-Timeframe Confirmation:
Add multi-timeframe analysis to ensure entry signals are supported by trends in larger timeframes. This can be implemented by checking moving average alignments and RSI readings across multiple time periods, thereby reducing false signals. -
Volatility Filters:
Implement volatility filtering mechanisms to pause trading or adjust risk parameters in extremely high volatility environments. ATR historical percentiles can be used as a measure of volatility, adopting more conservative trading strategies when volatility exceeds specific thresholds. -
Capital Management Optimization:
Implement more advanced capital management systems that dynamically adjust position sizes based on account size, recent strategy performance, and market conditions. For example, gradually increase positions after consecutive profits and reduce positions after consecutive losses.
Summary
The High-Frequency Dip Buying Strategy is a quantitative trading system specifically designed for bull market environments, capturing price retracement opportunities by identifying oversold conditions in combination with moving average trend confirmations. Compared to the original version, this strategy achieves significant performance improvements through parameter optimization and enhanced risk management features, delivering an additional 312.6% return and a 74.8% win rate.
The core advantages of the strategy lie in its dynamic risk management system and high win rate performance, making it excel in bull market environments. However, the strategy also has risks such as strong dependency on market environments and potential large drawdowns during trend reversals.
Future optimization directions primarily focus on adaptive parameter adjustment, market state classification, machine learning applications, multi-timeframe analysis, and more advanced capital management systems. Through these optimizations, the strategy aims to maintain stable performance across different market environments, further improving its robustness and profitability.
Regardless of which optimization measures are adopted, traders should always remember market risks, conduct thorough backtesting verification, and adjust strategy parameters and capital allocation according to personal risk tolerance and investment objectives.
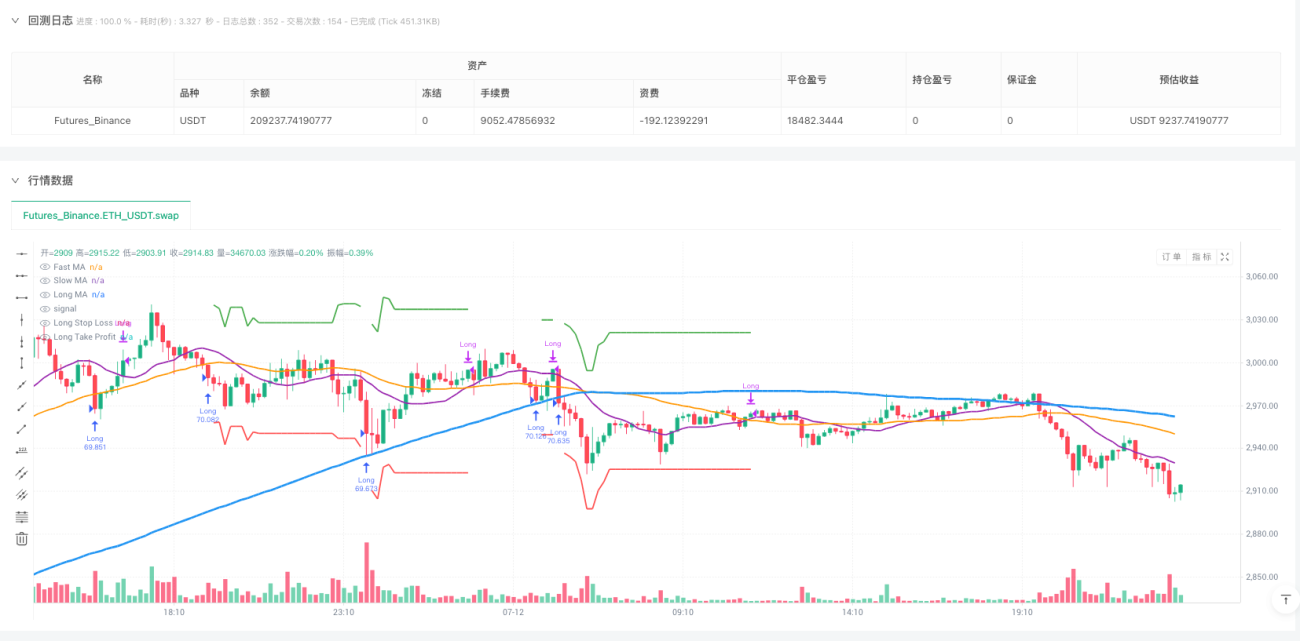
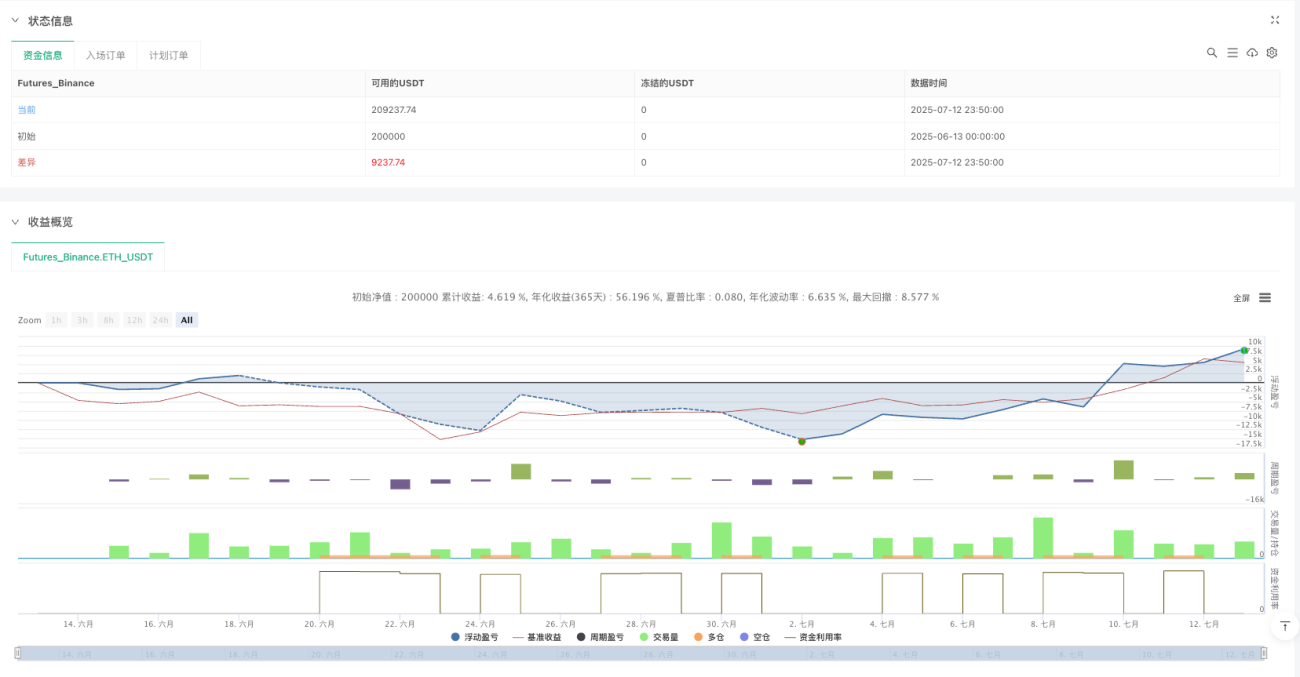
/*backtest
start: 2025-06-13 00:00:00
end: 2025-07-13 00:00:00
period: 10m
basePeriod: 10m
exchanges: [{"eid":"Futures_Binance","currency":"ETH_USDT","balance":200000}]
*/

// === DESCRIPTION ===
// Buy The Dips Bull Market Strategy - Optimized
// Modified strategy based on the original 2020 strategy from Coinrule
// Optimized parameters based on 2+ years of BTC hourly data analysis- 1