
Overview
The Multi-Dimensional Market Analysis Quantitative Trading Strategy is a highly intelligent quantitative trading system that integrates multiple technical indicators and market state recognition algorithms to analyze market behavior in real-time and provide trading signals. The core of this strategy lies in its unique market type recognition mechanism, which can automatically identify 10 different market states (such as bull market, bear market, box, volatility, etc.), and dynamically adjust indicator weights based on the current market environment to optimize the decision-making process. The strategy combines trend following, momentum analysis, volume analysis, and candlestick pattern recognition across multiple dimensions, calculating market signal strength through a comprehensive scoring system to ultimately form clear buy or sell decisions.
Strategy Principles
The strategy principles are based on a multi-layered market analysis framework:
-
Basic Indicator Calculation: First, the strategy calculates various technical indicators as the foundation for decision-making, including EMA(55), volume SMA(20/40/10), MACD(12,26,9), RSI(14), and ATR(14).
-
Market State Recognition: The strategy has designed a comprehensive market type recognition algorithm that can accurately determine when the current market is in one of the following 10 states:
- Bull: Price above EMA55, MACD line above signal line, RSI>50, relative volume>1
- Bear: Price below EMA55, MACD line below signal line, RSI<50, volume greater than average
- Sideways: Difference between price and EMA55 less than 0.5 times ATR, and ATR lower than its 20-period average
- Volatile: ATR higher than 1.2 times its 20-period average
- Momentum: Price change greater than 1.5 times ATR, and volume greater than 1.5 times its 20-period average
- Mean Reversion: RSI>70 or RSI<30
- Box: Sideways and price range less than 0.8 times its 20-period average
- Macro: Absolute value of price change greater than 2 times ATR
- Wolf: Price change less than -ATR and price below EMA55
- Eagle: Bull market and ATR lower than 0.8 times its 20-period average
-
Dynamic Weight Matrix: The strategy automatically adjusts the weights of various indicators based on the identified market type. For example, in a bull market environment, the weights of trend and MACD indicators are increased to 2.0, while in other market types, the weights of various indicators differ.
-
Comprehensive Scoring System: The strategy calculates a 0-100 comprehensive score through weighted calculation of each indicator's score. A score greater than 65 indicates a strong buy signal, less than 35 indicates a strong sell signal, and the middle range suggests unclear market conditions, recommending observation.
-
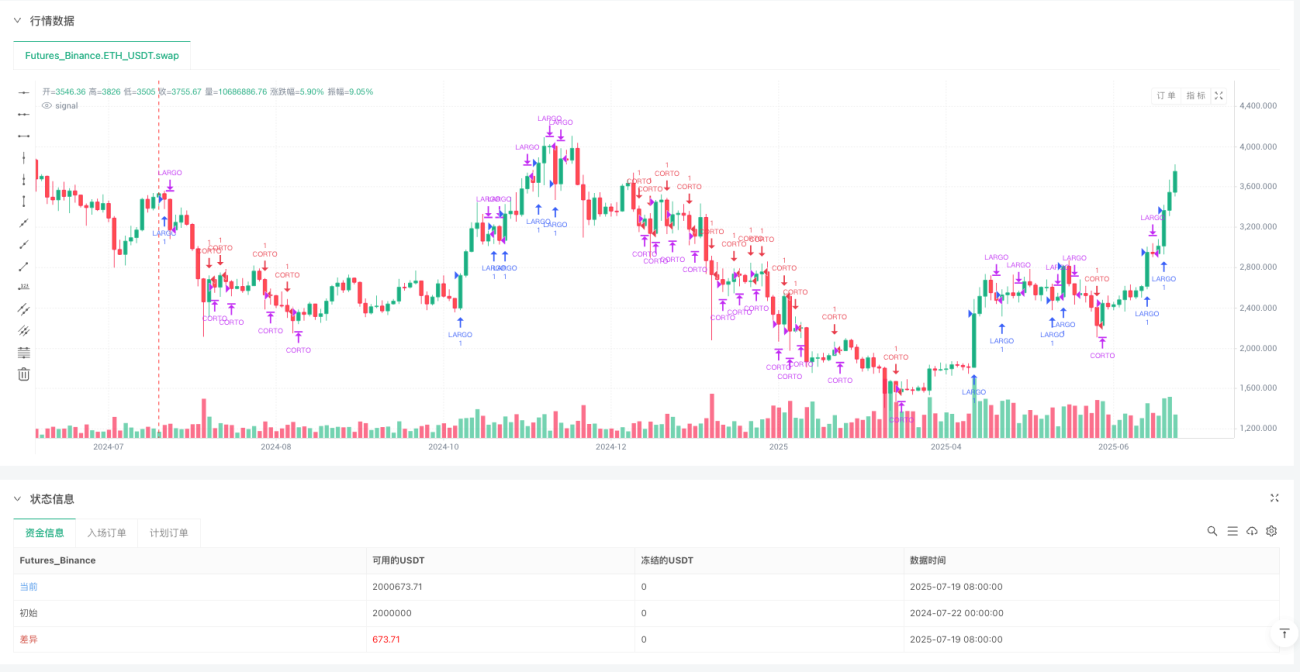
Trading Rules: The strategy opens long positions when it identifies bull market, eagle market, or momentum market with a score greater than 65; it opens short positions when it identifies bear market or wolf market with a score less than 35. When the conditions are no longer met, it automatically closes positions.
Strategy Advantages
-
Multi-dimensional Analysis: The strategy not only focuses on price trends but also comprehensively considers volume, volatility, market state, and other dimensions, capturing market opportunities from all angles.
-
Intelligent Market Recognition: It can automatically identify 10 different market states. This refined market classification greatly improves the strategy's adaptability, allowing it to maintain effectiveness in different market environments.
-
Dynamic Weight Adjustment: The core advantage of the strategy is its dynamic weight mechanism, which automatically adjusts the importance of various indicators according to different market types, avoiding blindly following certain indicators in unsuitable market environments.
-
Visual Decision Panel: The strategy provides a detailed visual panel that clearly displays the status of various indicators, market type, and comprehensive score, making it easy for traders to understand the current decision logic.
-
Integration of Multiple Technical Analysis Methods: The strategy organically combines trend following, momentum, mean reversion, volume analysis, and candlestick pattern recognition, forming a comprehensive analysis system.
-
Clear Entry and Exit Signals: Through the comprehensive scoring system, the strategy provides clear trading signals, reducing the subjectivity and indecision in trading decisions.
Strategy Risks
-
Parameter Sensitivity: The strategy uses multiple indicators and thresholds, and these parameter settings may significantly impact strategy performance. In different market environments or instruments, these parameters may need adjustment, otherwise, they may lead to false signals. The solution is to optimize parameters through backtesting or create adaptive parameter sets for different trading instruments.
-
Rapid Market Transition Risk: When market states change rapidly, the strategy may not capture changes in time, leading to delayed reactions. This can be mitigated by adding short-term indicators or setting more sensitive market state transition detection mechanisms.
-
False Breakout Risk: In box markets, false breakouts may occur, leading to incorrect signals. It is recommended to add confirmation mechanisms to the strategy, such as waiting for the price to continue in the breakout direction for a certain period or combining with other indicators for confirmation.
-
Overtrading Risk: In highly volatile markets, scores may fluctuate frequently, leading to overtrading. This can be reduced by setting minimum holding periods or adding trade filtering conditions to reduce unnecessary trades.
-
System Complexity: The strategy combines multiple indicators and market states, making the system relatively complex, which may increase the risk of errors or overfitting. It is recommended to periodically evaluate the contribution of each component, retain the truly effective parts, and simplify the system.
Strategy Optimization Directions
-
Adaptive Parameter Adjustment: Currently, the strategy uses fixed parameter values. An adaptive mechanism could be introduced to automatically adjust indicator parameters based on market volatility, such as using longer-period moving averages in high-volatility markets and shorter-period ones in low-volatility markets. This can improve the strategy's adaptability in different market environments.
-
Enhanced Market State Transition Detection: Machine learning algorithms could be introduced to optimize market state recognition by training models to learn the characteristics of different market states, improving recognition accuracy and transition sensitivity.
-
Integration of Multiple Timeframe Information: The current strategy only analyzes based on a single timeframe. Multi-timeframe analysis could be introduced to ensure that the trading direction is consistent with the trend of larger timeframes, increasing the win rate.
-
Risk Management Optimization: Position size and stop-loss levels could be dynamically adjusted based on market volatility and current market state, reducing positions in high-risk environments and appropriately increasing positions in low-risk environments.
-
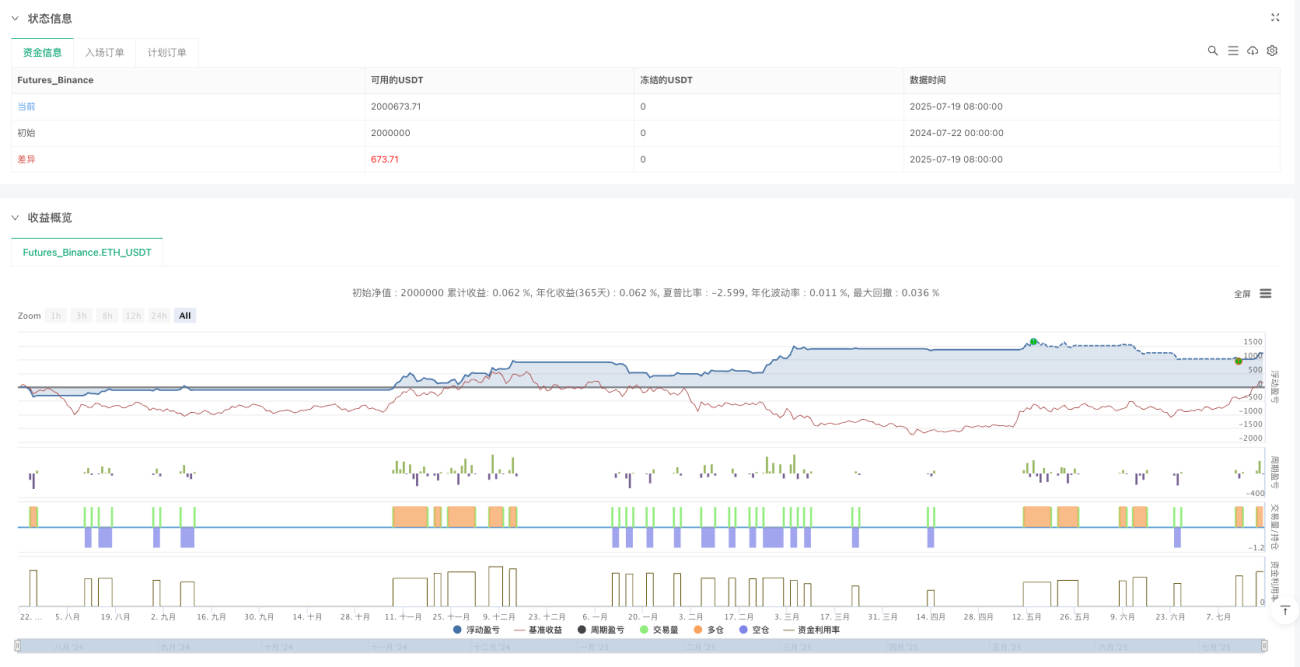
Drawdown Control Mechanism: Design a risk control mechanism based on account drawdown that automatically reduces trading frequency or pauses trading when the strategy drawdown reaches a certain threshold, protecting capital safety.
-
Optimization of Candlestick Pattern Recognition: The current strategy only recognizes simple hammer lines and engulfing patterns. More high-reliability candlestick patterns could be expanded and combined with volume confirmation to improve pattern recognition accuracy.
-
Seasonality and Time Factors: Analysis of trading sessions, day of the week, month, and other time factors could be introduced to capture the seasonal characteristics of the market and optimize trading timing.
Summary
The Multi-Dimensional Market Analysis Quantitative Trading Strategy is a comprehensive, intelligent quantitative trading system that achieves multi-dimensional market analysis by integrating multiple technical indicators and innovative market state recognition mechanisms. The core advantage of the strategy lies in its ability to accurately identify different market environments and dynamically adjust the weights of various indicators, thereby optimizing the decision-making process and improving trading success rates.
This strategy is particularly suitable for medium to long-term traders because it can effectively identify market trend transition points and maintain positions in favorable market environments. The strategy's visual panel also provides traders with a clear market analysis view, facilitating understanding of the current market state and decision logic.
Despite the high complexity of the strategy, its modular design allows each part to be independently optimized and adjusted, enabling traders to customize it according to their preferences and market characteristics. By implementing the aforementioned optimization suggestions, this strategy has the potential to further improve its stability and profitability in various market environments, becoming a powerful quantitative trading tool.
- 1