
Overview
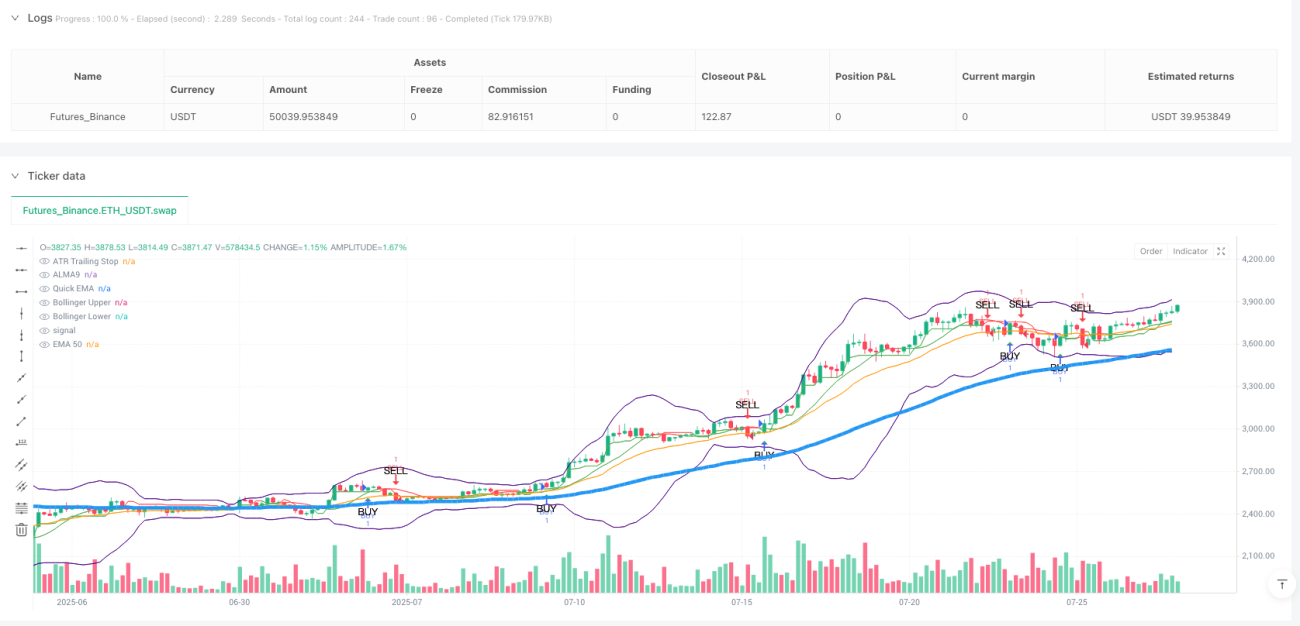
The Multi-Factor ALMA-ATR Adaptive Trend Following Strategy is a comprehensive trading system that combines multiple technical indicators to optimize entry and exit timing. At its core, the strategy employs ALMA (Arnaud Legoux Moving Average) as the primary trend determination tool, while integrating ATR volatility filtering, RSI momentum confirmation, ADX trend strength verification, and Bollinger Band volatility control mechanisms. The strategy also incorporates the UT Bot system, an ATR-based trailing stop and signal system designed to enhance trade exit precision.
Strategy Principles
The core principle of this strategy is to conduct trades through the synergistic action of multiple technical indicators, ensuring that trends are clear and volatility is moderate. Specifically:
- Uses ALMA as the primary trend indicator, which offers smoother and less lagging characteristics compared to traditional EMA or SMA.
- Implements volatility filtering: requires ATR values above a set minimum threshold to ensure sufficient market volatility.
- Entry conditions include: price above both EMA50 and ALMA9, RSI above oversold levels and greater than 30, ADX greater than 30 (indicating strong trend), price below the upper Bollinger Band, and meeting cooldown period requirements.
- Exit conditions: price falls below the fast EMA, or triggers ATR-based stop-loss/take-profit, or meets time-based exit criteria.
- Integrates the UT Bot system, using an ATR-based trailing stop line to provide additional protection mechanisms for trades.
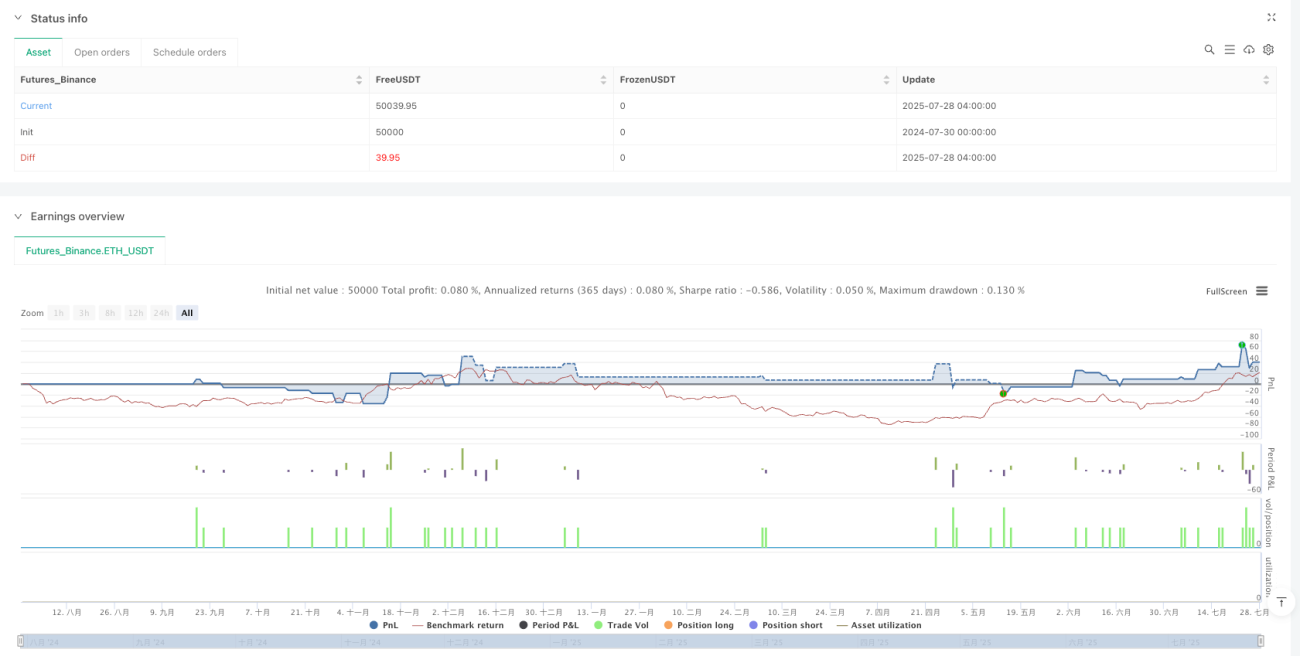
The strategy employs dynamic risk management methods, with stop-loss and take-profit levels both calculated based on ATR, allowing the strategy to adapt to volatility changes across different market conditions.
Advantage Analysis
This strategy offers several significant advantages:
- Multiple Confirmation Mechanisms: By integrating multiple technical indicators (ALMA, RSI, ADX, Bollinger Bands, etc.), it enhances signal reliability and reduces false signals.
- Strong Adaptability: Dynamic stop-loss and take-profit levels based on ATR enable the strategy to adapt to changes in market volatility.
- Effective Trend Capture: ALMA's low lag characteristics, combined with ADX trend strength confirmation, help capture trend changes promptly.
- Comprehensive Risk Control: Provides multi-layered risk protection through volatility filtering, dynamic stop-loss, and cooldown period mechanisms.
- Clear Visualization: The strategy marks buy and sell signals on the chart, allowing traders to intuitively understand market conditions.
- High Flexibility: Through parameter adjustments, the strategy can adapt to different market environments and trading cycles.
Risk Analysis
Despite its comprehensive design, the strategy still presents the following potential risks:
- Parameter Optimization Risk: Excessive parameter optimization may lead to good performance on historical data but poor results in actual trading.
Solution: Use forward testing and out-of-sample data validation to ensure parameter robustness. - Trend Reversal Risk: During strong trend reversals, the strategy may not react quickly enough, leading to profit retracement.
Solution: Consider adding trend reversal warning indicators, such as momentum oscillators or volume analysis. - Overtrading Risk: In ranging markets, too many trading signals may be generated.
Solution: Enhance volatility filtering conditions or pause trading after identifying ranging markets. - Stop-Loss Trap Risk: The market may trigger stop-losses and then quickly resume the original trend.
Solution: Consider using partial stop-loss strategies or dynamically adjusting stop-loss multipliers for different market conditions. - Lag Risk: Although ALMA has less lag, all technical indicators inherently have some degree of lag.
Solution: Consider adding forward-looking indicators or optimizing ALMA parameter settings.
Optimization Directions
Based on the analysis of the strategy, the following optimization directions are recommended:
- Market State Classification: Introduce market state recognition mechanisms to use different parameter settings under different market states (trending, ranging, high volatility, etc.). This can improve the strategy's adaptability across various market environments.
- Volume Integration: Incorporate volume indicators into the strategy as auxiliary tools for trend confirmation, which can enhance signal reliability.
- Multi-Timeframe Analysis: Introduce multi-timeframe confirmation mechanisms to ensure trade direction aligns with trends in higher timeframes.
- Machine Learning Optimization: Use machine learning algorithms to dynamically adjust parameters or predict optimal entry/exit points.
- Take-Profit Strategy Improvement: Implement partial take-profit or dynamic take-profit based on market structure to improve capital efficiency.
- Signal Quality Scoring: Develop a signal quality scoring system, executing trades only when signal strength exceeds specific thresholds.
- Drawdown Control Optimization: Introduce overall position control mechanisms to reduce positions or pause trading when drawdowns exceed certain levels.
These optimization directions aim to enhance the strategy's robustness, reduce drawdowns, and maintain consistent performance across different market environments.
Summary
The Multi-Factor ALMA-ATR Adaptive Trend Following Strategy is a comprehensive trading system with robust risk control. By integrating multiple technical tools such as ALMA, ATR, RSI, ADX, Bollinger Bands, and UT Bot, the strategy can effectively identify trends, filter noise, control risk, and enter and exit at appropriate times. The core advantages lie in its multiple confirmation mechanisms and adaptive risk management system, allowing it to maintain stable performance across different market environments.
Nevertheless, any trading strategy faces challenges brought by market uncertainty. Through continuous optimization of parameter settings, introduction of market state classification, integration of multi-timeframe analysis, and other methods, there remains significant room for improvement in this strategy. For quantitative traders, this represents a strategy with a solid foundational framework that can be further customized and optimized according to individual risk preferences and market understanding.
- 1