Dynamic Regression Channel Trend-Following Quantitative Trading Strategy

Overview
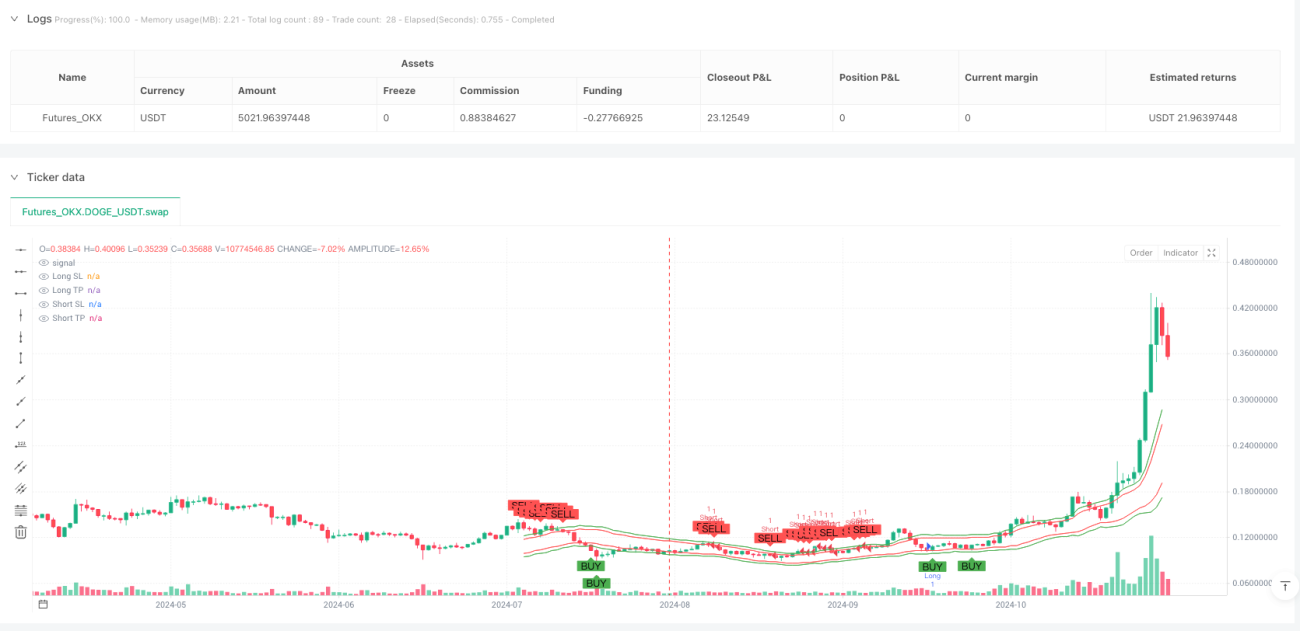
The Dynamic Regression Channel Trend-Following Quantitative Trading Strategy is an advanced quantitative trading method based on linear regression channels, combining linear regression and the ATR indicator to construct dynamic price channels for automated trend-following trading. The core of this strategy lies in using linear regression to analyze price movements, dynamically adjusting channel width through ATR, buying near the lower band during uptrends, selling near the upper band during downtrends, while automatically setting stop-loss and take-profit targets to effectively capture trending opportunities. The strategy can be applied to multiple timeframes, with a default 15-minute timeframe, making it suitable for medium to short-term trend traders.
Strategy Principles
This strategy is based on the combination of linear regression channels and trend direction determination, with detailed technical implementation including:
-
Linear Regression Channel Construction: Uses a 50-period linear regression to calculate the baseline trend line (y1, y2), forming the center line. The channel width is calculated based on the 14-period ATR value multiplied by a factor of 2.0, creating upper and lower bands at equal distances from the baseline, forming a complete parallel channel.
-
Trend Determination Mechanism: Determines trend direction through the slope of the linear regression line (y2-y1), with a positive slope indicating an uptrend and a negative slope indicating a downtrend.
-
Entry Signal Generation: After confirming trend direction, the strategy employs a "counter-trend retracement" entry mechanism:
- In uptrends, buy signals are generated when price retraces to near the lower band (lower band + 20% of channel width)
- In downtrends, sell signals are generated when price rebounds to near the upper band (upper band - 20% of channel width)
-
Automated Risk Management: The strategy incorporates intelligent stop-loss and profit target settings:
- Long position stop-loss set at the channel lower band
- Long position take-profit set at the middle band plus 1.5 times the channel width
- Short position stop-loss set at the channel upper band
- Short position take-profit set at the middle band minus 1.5 times the channel width
-
Real-time Channel Adjustment: The channel is recalculated and redrawn at the end of each bar, ensuring adaptation to the latest market conditions.
Strategy Advantages
In-depth analysis of this strategy reveals several key advantages:
-
Strong Trend Adaptability: By calculating trend direction through linear regression, it automatically adapts to both uptrends and downtrends, avoiding counter-trend trading and improving win rates.
-
Dynamic Risk Management: Through the ATR indicator, the channel width adjusts dynamically, enabling the strategy to automatically adapt to market volatility—widening the channel during high volatility periods to reduce noise and narrowing it during low volatility periods to increase sensitivity.
-
Precise Entry Points: Rather than simply entering when price touches the channel boundary, it sets a 20% buffer zone, reducing risks from false breakouts.
-
Automated Stop-Loss and Take-Profit: Built-in stop-loss and take-profit settings eliminate the need for manual intervention, reducing emotional impact and improving disciplined execution.
-
Visual Intuitiveness: Graphically displays channels, buy/sell signals, and stop-loss/take-profit levels, allowing traders to visually understand market structure and strategy logic.
-
Multi-timeframe Adaptability: Can be applied to different timeframes through parameter adjustments, accommodating various trading styles and time preferences.
Strategy Risks
Despite its sophisticated design, the strategy has the following risks and limitations:
-
Trend Reversal Risk: During sudden trend reversals, the strategy may not adapt quickly enough, resulting in stop-losses being triggered. A solution is to add trend strength filters, trading only when trends are clear.
-
Poor Performance in Ranging Markets: In sideways markets with no clear trend, the strategy may generate frequent false signals. Adding trend confirmation indicators like ADX and pausing trading when trends are unclear can mitigate this.
-
Parameter Sensitivity: Settings such as regression length and channel width multiplier significantly impact strategy performance; improper parameter optimization may lead to overfitting. Forward testing and robustness analysis are recommended for determining parameters.
-
Stop-Loss Placement Risk: Setting stop-losses at channel boundaries may be too close in highly volatile markets, being triggered by minor retracements. Consider dynamically adjusting stop-loss distances based on market conditions.
-
Lack of Volume Confirmation: The strategy is based solely on price action without considering confirming indicators like volume, potentially generating false signals in low liquidity conditions.
Strategy Optimization Directions
Based on code analysis, the strategy can be optimized in the following directions:
-
Add Trend Strength Filtering: Introduce ADX or similar indicators to evaluate trend strength, trading only when trends are clear (e.g., ADX>20) to improve signal quality. This optimization can reduce false signals in ranging markets.
-
Dynamic Stop-Loss Mechanism: Current stop-loss positions are fixed at channel boundaries; consider changing to ATR-based dynamic stop-losses or trailing stops to better protect profits.
-
Add Volume Confirmation: Incorporate volume indicators to confirm signal validity, such as requiring increased volume with buy signals, to reduce false breakouts.
-
Multi-timeframe Confirmation: Add higher timeframe trend confirmation mechanisms to avoid trading against the main trend, such as only entering when the daily trend aligns with the current trading direction.
-
Optimize Entry Timing: The current fixed 20% channel width buffer could be dynamically adjusted based on market volatility to improve entry precision.
-
Extended Backtesting: Conduct backtests over longer time periods and different market environments to verify strategy robustness and adaptability.
-
Money Management Optimization: Introduce dynamic position sizing, adjusting trading volume based on trend strength, volatility, and account risk, rather than using fixed trading units.
Summary
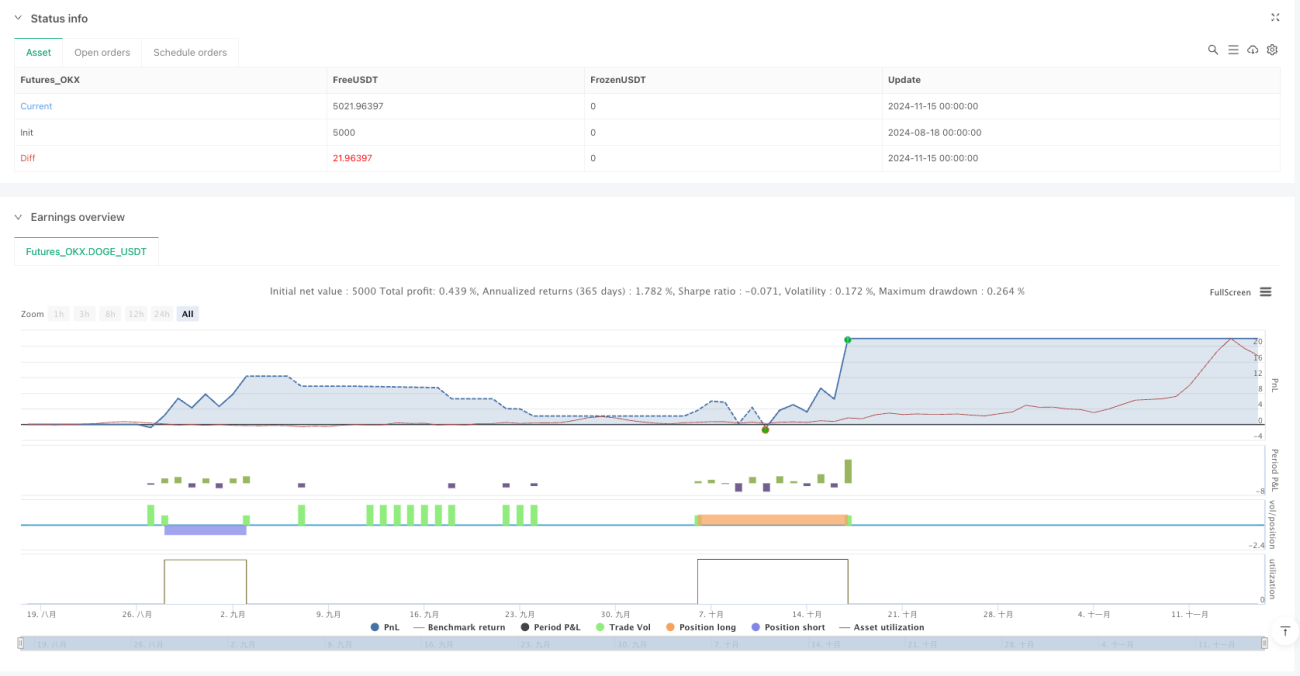
The Dynamic Regression Channel Trend-Following Quantitative Trading Strategy is a technically advanced, logically clear trend-following trading system that constructs dynamic price channels through linear regression and ATR indicators, trading price retracements or rebounds in the trend direction with built-in intelligent risk management mechanisms. The strategy's strengths lie in its strong trend adaptability, dynamic risk management, and automated execution, making it particularly suitable for medium to short-term trend-following trading.
However, the strategy has limitations in ranging markets and trend reversal environments, which can be optimized by adding trend strength filtering, multi-timeframe confirmation, and dynamic stop-losses. With appropriate parameter adjustments and optimization measures, this strategy has the potential to become a robust quantitative trading tool.
For quantitative traders, understanding the strategy principles and making appropriate adjustments based on personal risk preferences and market environments is key to successfully applying this strategy. Whether as an independent trading system or part of an investment portfolio, this strategy can provide market participants with a systematic trend-following solution.
- 1