Dynamic EMA Trend Capture with Support-Resistance Confirmation Trading Strategy

Overview
The Dynamic EMA Trend Capture with Support-Resistance Confirmation Trading Strategy is a trend-following system that combines classic EMA crossover techniques with support and resistance confirmation. This strategy identifies potential trend changes through the crossover of fast and slow Exponential Moving Averages (EMAs) and uses support and resistance levels as additional filtering conditions to improve the accuracy of trading signals. This dual confirmation mechanism effectively reduces false signals, helping traders execute trades within favorable market structures. The core concept is to execute buy trades only when prices are near support levels and sell trades only when prices are near resistance levels, allowing traders to better capture price rebounds and pullbacks.
Strategy Principles
The core principles of this strategy are based on the combination of two key technical indicators:
-
EMA Crossover Signals: The strategy uses two exponential moving averages with different periods, defaulting to a 10-period fast EMA and a 30-period slow EMA. A buy signal is generated when the fast EMA crosses above the slow EMA, while a sell signal is generated when the fast EMA crosses below the slow EMA. This crossover behavior is typically considered an early indicator of trend changes.
-
Support/Resistance Filtering: The strategy determines support and resistance levels using the lowest low and highest high over a lookback period of 50 bars (customizable). Buy signals are only confirmed and executed when the price is near support (within 5% of the support level), and sell signals are only confirmed and executed when the price is near resistance (within 5% of the resistance level).
Through code analysis, we can see that the strategy execution logic is as follows:
Buy Condition = Fast EMA crosses above Slow EMA AND Price is near support
Sell Condition = Fast EMA crosses below Slow EMA AND Price is near resistance
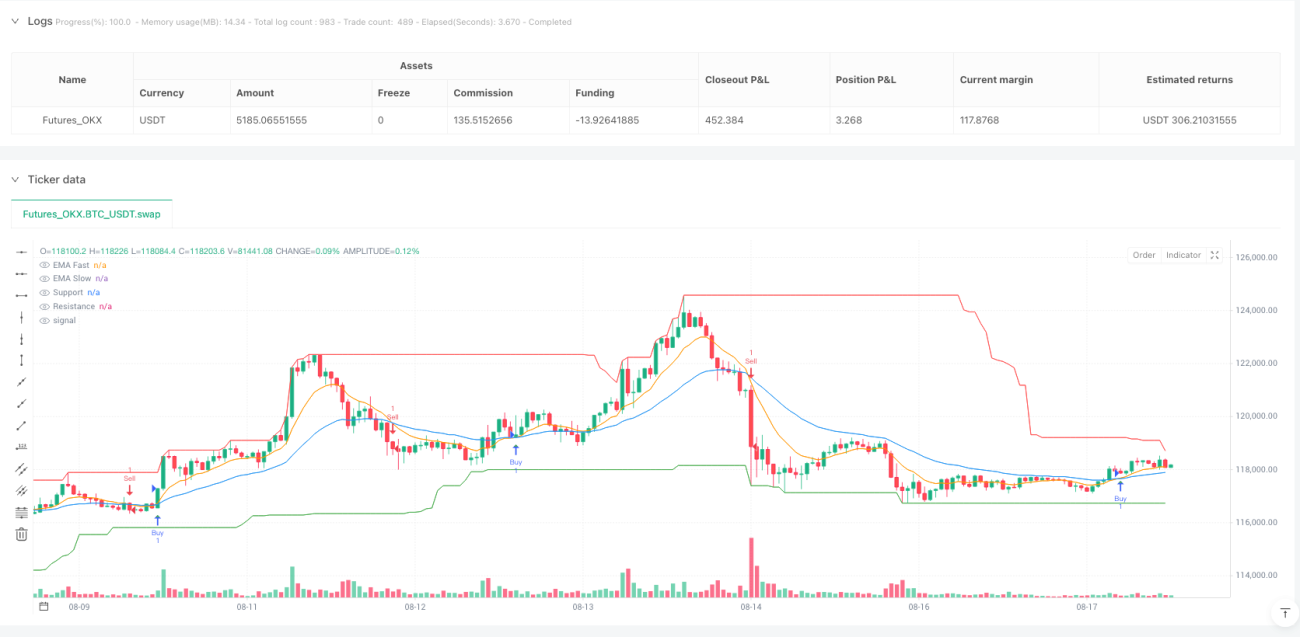
To avoid duplicate trades, the strategy also maintains variables tracking the current trading status (inLong and inShort), ensuring that no new positions are opened when an existing position is already active. When a trading signal is triggered, the system marks the corresponding buy or sell label on the chart and uses arrows to indicate entry points, allowing traders to visually understand the strategy signals.
Strategy Advantages
-
Dual Confirmation Mechanism: By combining EMA crossovers with support and resistance levels, the strategy significantly reduces false signals that might occur when relying solely on EMA crossovers, improving the reliability and accuracy of trading signals.
-
Trend-Following Approach: The strategy design ensures that trade direction is always aligned with the major trend, confirming uptrends near support levels for buy signals and downtrends near resistance levels for sell signals, avoiding the risks of counter-trend trading.
-
Enhanced Risk Management: By executing trades at key price levels, the strategy provides traders with clearer stop-loss and profit-taking positions, facilitating more reasonable risk-reward ratios.
-
Visually Clear Trading Signals: The strategy clearly marks buy and sell signals and entry prices on the chart, allowing traders to quickly identify trading opportunities and reducing the subjectivity of trading decisions.
-
High Customizability: Allows traders to adjust EMA periods and support/resistance lookback periods according to different markets and timeframes, making the strategy more adaptable.
-
Integrated Capital Management: The strategy defaults to using a percentage of account equity for position sizing, which is a conservative and professional money management method that helps control risk for each trade.
Strategy Risks
-
Lag Risk: EMA indicators are inherently lagging, which may lead to slightly delayed entries compared to ideal entry points, especially in volatile markets where important turning points might be missed. A solution is to consider adding more sensitive indicators or reducing the period of the fast EMA.
-
Frequent Trading in Ranging Markets: During price consolidation, EMAs may produce multiple crossovers, which could lead to overtrading even with support/resistance filtering. It is recommended to pause using this strategy in obvious ranging markets or add additional volatility filtering conditions.
-
Inaccurate Support/Resistance Identification: Simply using the highest high and lowest low to determine support and resistance levels may not be precise enough, especially in markets with abnormal volatility. Consider using more complex support/resistance identification algorithms, such as fractals, supply/demand zones, or price cluster areas.
-
Limitations of Fixed Percentage Range: The strategy uses a fixed 5% range to determine if the price is near support/resistance levels, which may not be flexible enough in markets with different volatility. The solution is to parameterize this range and adjust it dynamically based on market volatility.
-
Lack of Stop-Loss Mechanism: The current strategy does not have a clear stop-loss logic, which may lead to significant losses when the market suddenly reverses. It is recommended to implement an automatic stop-loss mechanism, such as ATR-based stops or stops based on key structural levels.
Strategy Optimization Directions
-
Dynamic EMA Parameters: The current strategy uses fixed EMA periods. Consider dynamically adjusting EMA parameters based on market volatility, such as using shorter periods in low-volatility markets and longer periods in high-volatility markets, to adapt to different market conditions.
-
Advanced Support/Resistance Identification: Improve the method of identifying support and resistance levels, for example, by using fractal theory, multi-timeframe support/resistance confirmation, or volume-price combined support/resistance judgment to obtain more accurate key price levels.
-
Add Trend Strength Filtering: Introduce trend strength indicators such as ADX (Average Directional Index) and only execute trades when trend strength is sufficient, avoiding frequent trading in weak trends or ranging markets.
-
Incorporate Volatility Adjustment: Dynamically adjust the range for determining "near support/resistance levels" based on ATR (Average True Range), expanding the range in high-volatility markets and narrowing it in low-volatility markets, making the strategy more adaptive.
-
Perfect Exit Logic: The current strategy focuses on entry conditions. Add exit logic based on profit targets, stop-losses, or reverse signals to form a complete trading system.
-
Add Time Filtering: Consider market seasonality and time characteristics by adding trading filters for specific time periods to avoid inefficient or high-risk trading sessions.
-
Multi-Timeframe Confirmation: Introduce trend judgment from higher timeframes to ensure that trading direction is consistent with trends in larger cycles, improving the success rate of trades.
Conclusion
The Dynamic EMA Trend Capture with Support-Resistance Confirmation Trading Strategy creates a trading system that both follows trends and respects key price levels by combining classic EMA crossover signals with support and resistance confirmation. This dual confirmation mechanism effectively filters out many potential false signals, improving the accuracy and reliability of trades.
The core advantage of the strategy lies in its respect for market structure, executing trades only when prices are near key support or resistance levels, which not only improves the quality of entry points but also provides clear reference points for risk management. The visualized trading signals make the strategy simple and intuitive to use, suitable for traders of all levels.
However, the strategy also has potential issues such as lag, overtrading, and precision in support/resistance identification. By introducing dynamic parameter adjustments, advanced support/resistance identification, trend strength filtering, and perfected exit logic, the performance of the strategy can be further enhanced.
Overall, this is a trend-following strategy with solid foundations and clear logic, providing traders with a reliable framework that can be customized and expanded based on individual trading styles and market characteristics.
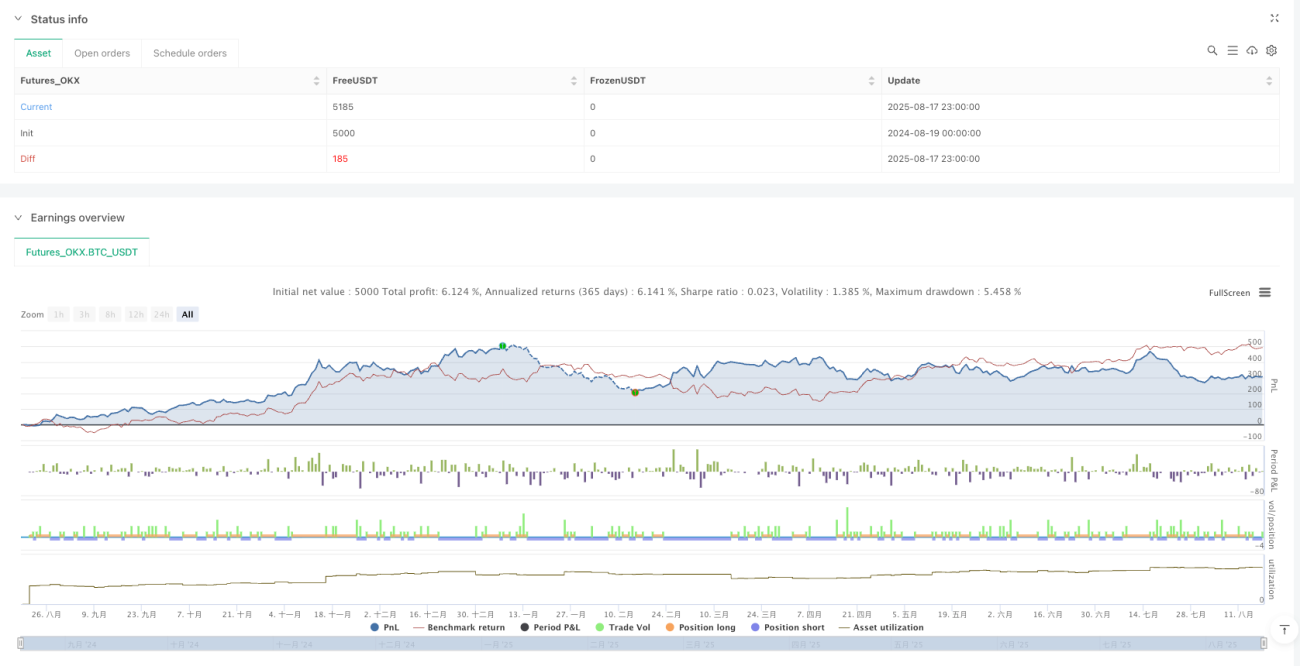
/*backtest
start: 2024-08-19 00:00:00
end: 2025-08-18 00:00:00
period: 1h
basePeriod: 1h
exchanges: [{"eid":"Futures_OKX","currency":"BTC_USDT","balance":5000}]
*/

//@version=5
strategy("EMA Crossover + Support/Resistance Filter Optimized", overlay=true, default_qty_type=strategy.percent_of_equity, default_qty_value=10)

// ==== INPUT ====- 1