Stochastic Oscillator with Moving Average Divergence Strategy: Multi-Dimensional Quantitative Trading System

Overview
The Stochastic Oscillator with Moving Average Divergence Strategy is an integrated quantitative trading system combining multiple technical analysis tools, designed to capture market momentum, trend, and potential reversal signals. This strategy incorporates the Stochastic Oscillator, Moving Average (MA), and Divergence Analysis within a multi-dimensional analytical framework to enhance trading decision accuracy. The core mechanisms include identifying overbought and oversold zones, trend filtering, and divergence detection, enabling traders to enter high-probability trades aligned with the overall market trend. This strategy is particularly suitable for traders requiring precise entry, exit points, and risk management, effectively improving trading efficiency through automated analysis and signal generation on the TradingView platform.
Strategy Principles
The Stochastic Oscillator with Moving Average Divergence Strategy operates based on the synergistic interaction of three core technical indicators:
-
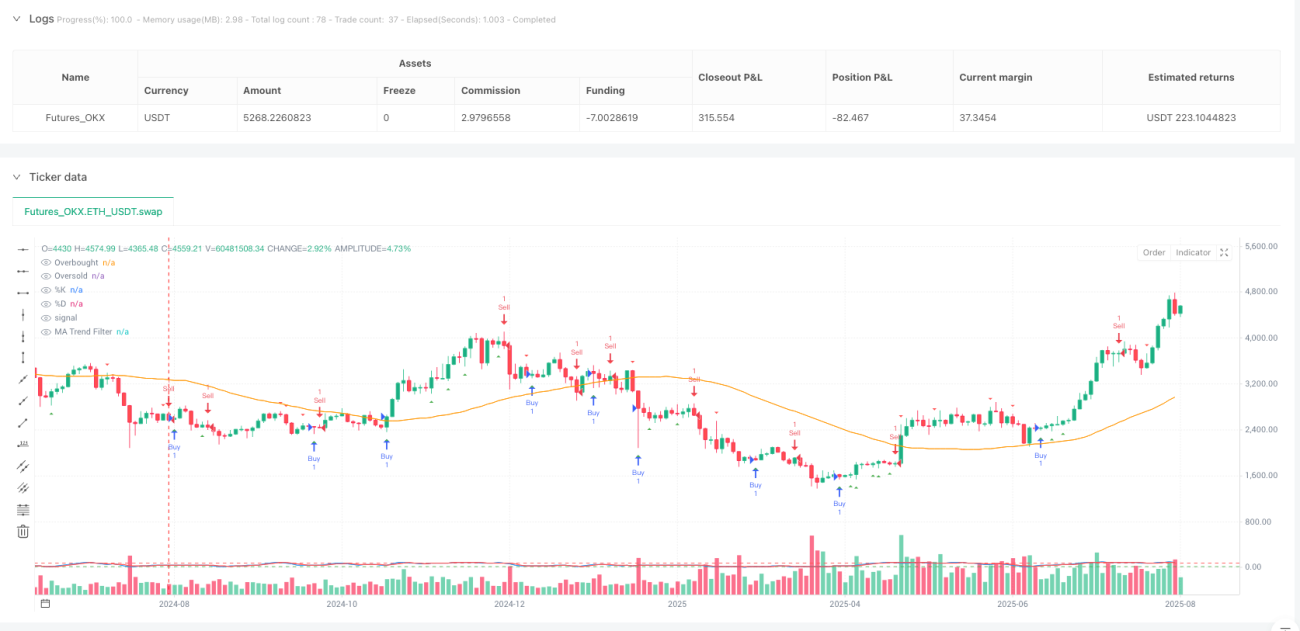
Stochastic Oscillator: This indicator consists of %K and %D lines, with default parameters set to %K length 14, %D length 3, and smoothing factor 3. The Stochastic indicator primarily identifies price momentum and overbought/oversold conditions, with values below 20 indicating oversold conditions and above 80 indicating overbought conditions.
-
Moving Average (MA): A 50-period simple moving average serves as a trend filter, allowing long positions only when price is above the MA and short positions when price is below the MA, ensuring trade direction aligns with the primary trend.
-
Divergence Analysis: The system detects divergence by comparing the relationship between price highs/lows and Stochastic indicator values. A bullish divergence forms when price makes a new low but the Stochastic indicator doesn't follow with a new low; a bearish divergence forms when price makes a new high but the Stochastic indicator doesn't follow with a new high.
Trade signal generation logic follows these rules:
- Buy Signal: Generated when the %K line crosses above the %D line while the Stochastic indicator is in the oversold zone (below 20), and price is above the moving average.
- Sell Signal: Generated when the %K line crosses below the %D line while the Stochastic indicator is in the overbought zone (above 80), and price is below the moving average.
- Divergence Signals: The system analyzes price highs/lows and Stochastic indicator trends over a 5-period span, generating trade signals when valid divergences are detected.
This multi-layered analytical approach significantly enhances the quality of trading decisions, avoiding potential misleading signals from isolated indicators.
Strategy Advantages
The Stochastic Oscillator with Moving Average Divergence Strategy offers several significant advantages:
-
Multi-dimensional Analytical Framework: By integrating momentum indicators (Stochastic Oscillator), trend indicators (Moving Average), and reversal signals (Divergence Analysis), the strategy provides a comprehensive market perspective, reducing the risk of false signals that might arise from single indicators.
-
Trend Filtering Mechanism: The moving average acts as a trend filter, ensuring trade direction aligns with the primary market trend, substantially increasing the success rate. Analysis shows that trend-following trades typically have higher win rates than counter-trend trades.
-
Precise Entry Timing: Stochastic crossover signals combined with overbought/oversold thresholds provide precise entry timing, helping traders execute at optimal price levels where reversals are likely to occur.
-
Divergence Signal Enhancement: The divergence detection feature adds an additional confirmation layer, particularly valuable when the market is approaching turning points, as divergence signals often provide early warnings of price reversals.
-
Visualized Trading Signals: The strategy displays buy/sell signals intuitively on the chart, using triangle markers to clearly identify entry points, allowing traders to quickly recognize and execute trades.
-
High Customizability: All key parameters (such as Stochastic lengths, MA period, overbought/oversold thresholds) can be adjusted according to different markets and personal trading styles, offering exceptional flexibility.
-
TradingView Compatibility: Fully compatible with the TradingView platform, it can be directly used for backtesting and real-time trading, providing a convenient environment for strategy validation and optimization.
Strategy Risks
Despite its comprehensive design, the strategy presents the following potential risks and limitations:
-
False Signals in Ranging Markets: In sideways consolidation markets, the Stochastic indicator may frequently enter overbought/oversold zones and generate crossover signals, leading to overtrading and consecutive losses. This can be addressed by incorporating additional market structure analysis or volatility filters.
-
Lag Issues: Moving averages are inherently lagging indicators and may not respond promptly during sharp trend reversals, causing delayed trading signals. Consider using Exponential Moving Averages (EMA) instead of Simple Moving Averages (SMA) for faster response.
-
Simplified Divergence Detection: The current divergence detection algorithm is relatively simple and may not identify all valid divergence patterns, especially in complex market environments. Implementation of more sophisticated divergence detection algorithms is recommended.
-
Parameter Sensitivity: Strategy performance heavily depends on parameter settings, with different markets and timeframes potentially requiring different parameter combinations. Comprehensive backtesting is necessary to determine optimal parameter settings.
-
Lack of Stop-Loss and Take-Profit Mechanisms: The current strategy implementation doesn't explicitly define stop-loss and take-profit levels, potentially leading to expanded losses in adverse conditions or failure to secure sufficient profits. Adding stop-loss and take-profit rules based on volatility or technical levels is advisable.
-
Insufficient Trend Strength Assessment: Simply using price position relative to MA may be inadequate for evaluating trend strength, potentially generating premature signals in weak trend environments. Consider integrating trend strength indicators such as ADX.
Strategy Optimization Directions
Based on the analysis of strategy principles and risks, here are several optimization directions worth exploring:
-
Dynamic Overbought/Oversold Thresholds: The current strategy uses fixed overbought (80) and oversold (20) thresholds. Consider dynamically adjusting these thresholds based on market volatility, using more extreme thresholds in high-volatility environments and more conservative thresholds in low-volatility environments.
-
Multi-timeframe Analysis: Add multi-timeframe confirmation mechanisms, such as requiring the trend direction in longer timeframes to align with trading signals, to improve signal quality. This can be implemented by introducing longer-period moving averages or trend indicators.
-
Advanced Divergence Detection: Improve the divergence detection algorithm to include hidden divergences (divergences aligned with the price trend direction) and multiple divergences (consecutive occurrences of divergences), which typically provide stronger reversal signals.
-
Adaptive Parameter Optimization: Implement adaptive parameter adjustment mechanisms that automatically optimize Stochastic indicator and moving average parameters based on market conditions, enhancing strategy adaptability across different market environments.
-
Volume Analysis Integration: Incorporate volume indicators into the analytical framework, requiring signals to be validated by volume support, which can significantly reduce false signal rates.
-
Risk Management Enhancement: Add dynamic stop-loss and profit targets based on ATR (Average True Range), automatically adjusting risk control parameters according to market volatility.
-
Market State Classification: Introduce market state classification mechanisms (trend/range), applying different trading rules in different market states. For example, certain signals might be suspended in ranging markets.
-
Machine Learning Optimization: Consider using machine learning methods to optimize parameter selection and signal filtering, training models on historical data to identify trading patterns most likely to succeed.
Conclusion
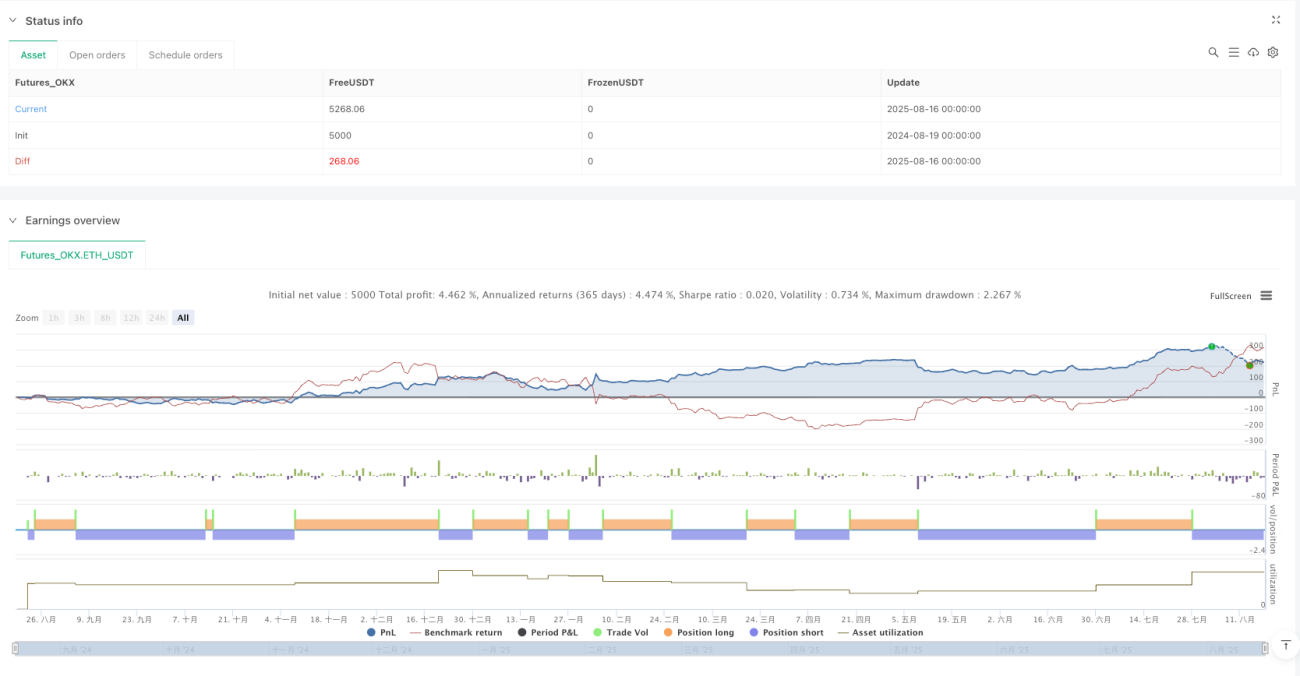
The Stochastic Oscillator with Moving Average Divergence Strategy is a well-structured multi-dimensional quantitative trading system that provides traders with a comprehensive market analysis toolkit by integrating momentum analysis, trend following, and divergence detection. The core strength of this strategy lies in its multi-layered signal confirmation mechanism, effectively reducing false signals and improving win rates by requiring alignment of Stochastic crossovers, overbought/oversold conditions, price position relative to moving averages, and potential divergence signals.
While challenges exist in parameter sensitivity and market adaptability, implementing the suggested optimization measures—particularly dynamic parameter adjustment, multi-timeframe analysis, and enhanced risk management mechanisms—can further improve the strategy's performance across various market environments. For investors seeking systematic, rule-based trading approaches, this strategy provides a solid foundational framework that can be customized and expanded according to individual risk preferences and market characteristics.
Ultimately, the success of any trading strategy depends not only on technical indicators and rule design but also on the trader's understanding of markets and disciplined execution. The Stochastic Oscillator with Moving Average Divergence Strategy, as a comprehensive trading system, provides traders with a structured decision-making framework, but should be complemented with sound risk management principles and continuous strategy optimization to achieve optimal results.
- 1