
En el trading cuantitativo, el gráfico de velas tradicional es una de las formas de representación de datos más utilizadas, pero también presenta ciertas limitaciones, como su insensibilidad a las fluctuaciones o al ruido excesivo. Para observar las tendencias de precios con mayor claridad, los operadores suelen utilizar gráficos mejorados, como:
- Renko: realiza sorteos basados en cambios de precios en lugar de tiempo, filtrando eficazmente el ruido del mercado.
- Heikin Ashi: suaviza los datos de precios para mostrar la dirección de la tendencia de forma más intuitiva.
Este artículo presentará cómo calcular gráficos de ladrillos y datos de línea K promedio basados en la línea K ordinaria en la plataforma de comercio cuantitativo FMZ, y mostrará el efecto de dibujo para ayudar a los desarrolladores de estrategias a analizar las tendencias del mercado de manera más intuitiva.
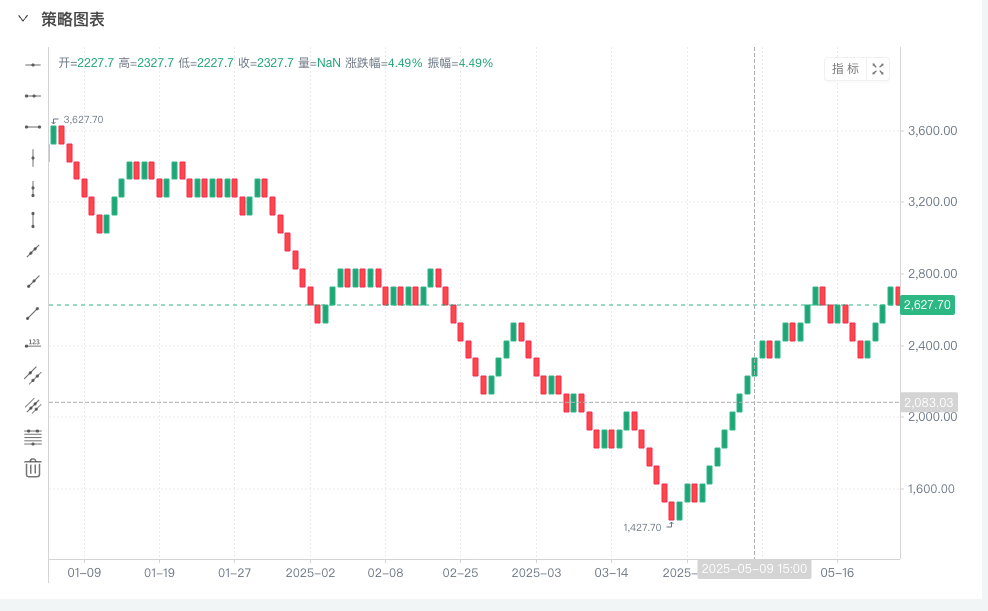
Gráfico de ladrillos (Renko)
El gráfico Renko utiliza "ladrillos" como unidades, y solo se dibuja un nuevo ladrillo cuando el precio fluctúa más allá de un rango fijo (como $100).
- Ventajas: Basándose en los cambios de precios, filtra pequeñas fluctuaciones en el mercado y destaca las principales tendencias.
- Escenarios aplicables: Adecuado para identificar tendencias a mediano y largo plazo y reducir la interferencia de ruido en las transacciones.
Interpretación de señales comerciales
- Confirmación de tendencia: los ladrillos en ascenso continuo indican una tendencia fuerte y puedes mantener una posición; la aparición de ladrillos inversos es una señal de inversión de tendencia.
- Operaciones de ruptura: cuando aparece un nuevo ladrillo, especialmente cuando rompe el máximo o mínimo anterior, considere ingresar al mercado.
- Filtrado de rupturas falsas: dado que el gráfico de ladrillo ignora las pequeñas fluctuaciones, ayuda a filtrar pequeñas rupturas falsas durante el período de oscilación.
Lógica de cálculo básica:
- Establecer el tamaño del ladrillo brickSize
- Con base en el precio inicial, compare constantemente si el último precio se desvía del precio del ladrillo anterior en más de brickSize
- Si el precio sube más allá del límite, se dibuja un ladrillo ascendente; lo mismo se aplica al precio descendente.
Calcula el diagrama de ladrillos (Renko) y dibuja el código:
javascript
/*backtest
start: 2025-05-01 00:00:00
end: 2025-06-06 00:00:00
period: 1h
basePeriod: 1m
exchanges: [{"eid":"Binance","currency":"ETH_USDT","balance":1000,"stocks":0.5}]
*/
let globalbricks = []
let lastBarTime = 0
function getBricks(r, brickSize, sourceAttribute, lastPrice) {
for (let i = 1; i < r.length; i++) {
let bar = r[i]
let price = bar[sourceAttribute]
let time = bar.Time
if (time < lastBarTime) {
continue
}
// 遍历原始K线数据
while (Math.abs(price - lastPrice) >= brickSize) {
if (globalbricks.length > 0 && time == globalbricks[globalbricks.length - 1].Time) {
time = globalbricks[globalbricks.length - 1].Time + 1000
}
// 构造砖块
let brick = {
Time: time,
Open: lastPrice,
Close: 0,
High: 0,
Low: 0
}
if (price > lastPrice) {
// 上涨砖块
lastPrice += brickSize
brick.Close = lastPrice
brick.High = lastPrice
brick.Low = brick.Open
} else {
// 下跌砖块
lastPrice -= brickSize
brick.Close = lastPrice
brick.High = brick.Open
brick.Low = lastPrice
}
// 放入数组
globalbricks.push(brick)
// time 累加1秒,防止一根BAR分成多块brick时断开
time += 1000
}
lastBarTime = bar.Time
}
return globalbricks
}
function getRenko(r, brickSize, sourceAttribute) {
// 原始K线数据如果不符合计算要求,直接返回
if (!r || r.length <= 0) {
return null
}
if (globalbricks.length == 0) {
return getBricks(r, brickSize, sourceAttribute, r[0][sourceAttribute])
} else {
return getBricks(r, brickSize, sourceAttribute, globalbricks[globalbricks.length - 1].Close)
}
}
function main() {
let c = KLineChart({
overlay: true
})
while (true) {
let r = _C(exchange.GetRecords)
let bricks = getRenko(r, 100, "Close")
bricks.forEach(function (brick, index) {
c.begin(brick)
c.close()
})
Sleep(1000)
}
}
Prueba retrospectiva
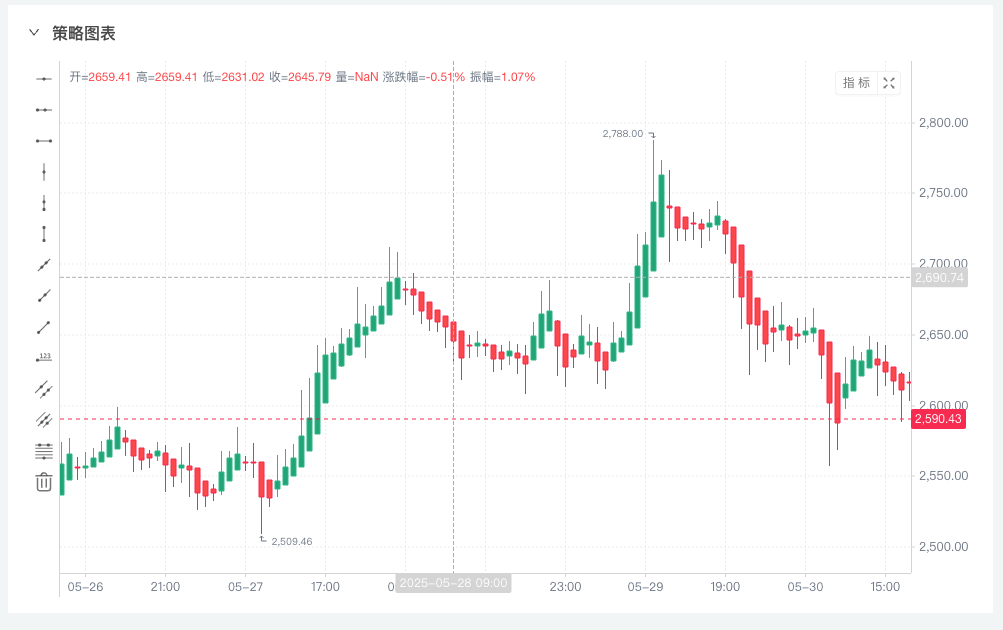
Heikin Ashi
Heikin Ashi es un proceso de suavizado de la línea K tradicional.
- Ventajas: Proporciona una dirección de tendencia más clara y reduce las señales falsas al suavizar los datos de precios.
- Escenarios aplicables: Aplicable a estrategias de seguimiento de tendencias, ayudando a los traders a mantener posiciones durante más tiempo en las tendencias.
El método de cálculo es el siguiente:
            HA_Close = (Open + High + Low + Close) / 4
HA_Open = (前一根 HA_Open + 前一根 HA_Close) / 2
HA_High = max(High, HA_Open, HA_Close)
HA_Low = min(Low, HA_Open, HA_Close)
Heikin Ashi 本质上是一种移动平均滤波的 K 线,具有趋势持续性更强的特点。
Juicio de tendencias y reconocimiento de señales
- Una vela alcista con un cuerpo grande y casi sin sombras superiores o inferiores indica una fuerte tendencia alcista.
- Una línea negativa con un cuerpo grande y casi sin sombras superiores o inferiores indica una fuerte tendencia a la baja.
- Las sombras superiores e inferiores se están alargando, y el cuerpo real se está reduciendo. La tendencia se está debilitando, así que cuidado con las reversiones.
- El cuerpo es muy corto y la sombra es larga. El mercado es volátil, así que no operes por ahora.
Código de implementación y dibujo:
            javascript

            /*backtest
start: 2025-05-01 00:00:00
end: 2025-06-06 00:00:00
period: 1h
basePeriod: 1h
exchanges: [{"eid":"Binance","currency":"ETH_USDT","balance":1000,"stocks":0.5}]
*/

function toHeikinAshi(records) {
    if (!records || records.length == 0) {
        return null
    }

    let haRecords = []

    for (let i = 0; i < records.length; i++) {
        let r = records[i]
        let ha = {}

        ha.Time = r.Time
        ha.Close = (r.Open + r.High + r.Low + r.Close) / 4

        if (i === 0) {
            // 第一根 Heikin Ashi 的开盘价用普通K线的开盘价和收盘价的均值
            ha.Open = (r.Open + r.Close) / 2
        } else {
            // 后续每根的开盘价 = 上一根Heikin Ashi开盘价和收盘价均值
            ha.Open = (haRecords[i - 1].Open + haRecords[i - 1].Close) / 2
        }

        ha.High = Math.max(r.High, ha.Open, ha.Close)
        ha.Low = Math.min(r.Low, ha.Open, ha.Close)

        haRecords.push(ha)
    }

    return haRecords
}

function main() {
    let c = KLineChart({
        overlay: true
    })

    while (true) {
        let r = _C(exchange.GetRecords)
        let heikinAshiRecords = toHeikinAshi(r)
        heikinAshiRecords.forEach(function (bar, index) {
            c.begin(bar)
            c.close()
        })
        Sleep(1000)
    }
}
Prueba retrospectiva
END
Los gráficos Renko y Heikin Ashi son herramientas poderosas para los traders de tendencias:
- El gráfico Renko se centra en el desplazamiento de precios y es adecuado para avances y confirmaciones de tendencias.
- Heikin Ashi se centra en la suavización de precios y es adecuado para el control de posiciones de tendencia.
- El uso complementario de ambos puede mejorar la estabilidad y la capacidad antichoque de las señales de estrategia de tendencia.
Se recomienda combinar backtesting y verificación en tiempo real, elegir una solución de gráficos que se adapte a sus propios productos y ciclos comerciales y crear un sistema comercial cuantitativo personalizado.
