

Implementación del lenguaje JavaScript del indicador Fisher y dibujo en FMZ
Al realizar un análisis técnico en el trading, los traders analizan y estudian los datos de los precios de las acciones como datos distribuidos normalmente. Sin embargo, la distribución de los datos de los precios de las acciones no se ajusta a la distribución normal estándar.Fisher TransformationEs un método que puede transformar los datos de precios en una distribución normal.Fisher TransformationSuavizar los datos del mercado y eliminar algunas oscilaciones bruscas de ciclos pequeños. Las señales comerciales se pueden generar utilizando el cruce de indicadores del día actual y el día anterior.
acerca deFisher TransformHay mucha información sobre Baidu y Zhihu, por lo que no entraré en detalles aquí.
Algoritmo indicador:
-
Precio medio de hoy:
mid=(low + high) / 2 -
Determinar el período de cálculo, puede utilizar 10 días como período. Calcular los precios más altos y más bajos dentro del período:
lowestLow = 周期内最低价,highestHigh = 周期内最高价。 -
Defina los parámetros de cambio de precio (donde
ratioes una constante entre 0 y 1, por ejemplo, 0,5 o 0,33):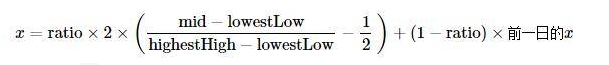
-
Parámetros de cambio de precio
xusarFisherTransformar, obtenerFisheríndice: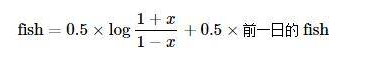
Implementar el algoritmo usando JavaScript
Implementarlo paso a paso de acuerdo al algoritmo del indicador. Cabe señalar que este algoritmo es un algoritmo iterativo.preX,preFishInicialmente establecido en 0. paraMath.logEsto es encontrar el logaritmo que tiene como base la constante natural e. Además, el algoritmo anterior no menciona la corrección de x, y casi pasé por alto este problema al escribirlo:
Corrija el valor de x. Si es mayor que 0,99, se forzará a 0,999. Lo mismo se aplica si es menor que -0,99.
if (x > 0.99) {
x = 0.999
} else if (x < -0.99) {
x = -0.999
}
La primera vez que miré este algoritmo y los indicadores, los trasplanté de acuerdo con el algoritmo. No he verificado esta implementación. Los estudiantes que estén interesados en realizar investigaciones pueden verificar si hay algún error. Muchas gracias por señalar el error.
Fisher TransformCódigo fuente del algoritmo indicador:
            javascript

            function getHighest(arr, period) {
    if (arr.length == 0 || arr.length - period < 0) {
        return null
    }
    var beginIndex = arr.length - period
    var ret = arr[beginIndex].High
    for (var i = 0 ; i < arr.length - 1 ; i++) {
        if (arr[i + 1].High > ret) {
            ret = arr[i + 1].High
        }
    }
    return ret
}

function getLowest(arr, period) {
    if (arr.length == 0 || arr.length - period < 0) {
        return null
    }
    var beginIndex = arr.length - period
    var ret = arr[beginIndex].Low
    for (var i = 0 ; i < arr.length - 1 ; i++) {
        if (arr[i + 1].Low < ret) {
            ret = arr[i + 1].Low
        }
    }
    return ret
}

function calcFisher(records, ratio, period) {
    var preFish = 0
    var preX = 0
    var arrFish = []
    // 当K线长度不足,不满足周期时
    if (records.length < period) {
        for (var i = 0 ; i < records.length ; i++) {
            arrFish.push(0)
        }
        return arrFish
    }

    // 遍历K线
    for (var i = 0 ; i < records.length ; i++) {
        var fish = 0
        var x = 0
        var bar = records[i]
        var mid = (bar.High + bar.Low) / 2
        // 当前BAR不足period计算时
        if (i < period - 1) {
            fish = 0
            preFish = 0
            arrFish.push(fish)
            continue
        }

        // 计算周期内最高价和最低价
        var bars = []
        for (var j = 0 ; j <= i ; j++) {
            bars.push(records[j])
        }
        var lowestLow = getLowest(bars, period)
        var highestHigh = getHighest(bars, period)

        // 价变参数
        x = ratio * 2 * ((mid - lowestLow) / (highestHigh - lowestLow) - 0.5) + (1 - ratio) * preX
        if (x > 0.99) {
            x = 0.999
        } else if (x < -0.99) {
            x = -0.999
        }
        preX = x
        fish = 0.5 * Math.log((1 + x) / (1 - x)) + 0.5 * preFish
        preFish = fish
        arrFish.push(fish)
    }
    return arrFish
}
Dibujo
Dibujar en FMZ es muy sencillo, Estrategia Cuadrada:https://www.fmz.com/squareHay muchos ejemplos arriba para referencia o búsqueda.
Debido a la extensión del artículo, el siguiente código de prueba de dibujo debe agregar la implementación de la función calcFisher anterior antes de poder ejecutarse.
            var cfg = {    // 用来初始化设置图表的对象(即图表设置)
    plotOptions: {
        candlestick: {
            color: '#d75442',  // 颜色值
            upColor: '#6ba583' // 颜色值
        }
    },
    title: { text: 'Fisher Transform'},     //标题
    subtitle: {text: ''},     //副标题
    plotOptions: {
        candlestick: {
        tooltip: {
            pointFormat:
            '<span style="color:{point.color}">\u25CF</span> <b> {series.name}</b><br/>' +
            '开盘: {point.open}<br/>' +
            '最高: {point.high}<br/>' +
            '最低: {point.low}<br/>' +
            '收盘: {point.close}<br/>'
            }
        }
    },
    yAxis: [{
        title: {
            text: 'K线行情'
        },
        height: '70%',
        lineWidth: 1
    }, {
        title: {
            text: 'Fisher Transform'
        },
        top: '75%',
        height: '30%',
        offset: 0,
        lineWidth: 1
    }],
    series: [//系列
        {
            type: 'candlestick',
            yAxis: 0,
            name: 'K线',
            id: 'KLine',
            // 控制走势为跌的蜡烛颜色
            color: 'green',
            lineColor: 'green',
            // 控制走势为涨的蜡烛颜色
            upColor: 'red',
            upLineColor: 'red',
            data: []
        },{
            type: 'line',         // 设置当前的数据序列 类型为: 线
            yAxis: 1,             // 使用的y轴 为索引为 0 的y轴(highcharts 图表 可以有 多个 y 坐标轴,这里指定索引0的y轴)
            showInLegend: true,   //
            name: 'fish',          // 根据 函数传入的 参数 label 设置
            lineWidth: 1,
            data: [],             // 数据序列的数据项
            tooltip: {            // 工具提示
                valueDecimals: 2  // 值的小数点 保留5位
            }
        },{
            type: 'line',         // 设置当前的数据序列 类型为: 线
            yAxis: 1,             // 使用的y轴 为索引为 0 的y轴(highcharts 图表 可以有 多个 y 坐标轴,这里指定索引0的y轴)
            showInLegend: true,   //
            name: 'preFish',      // 根据 函数传入的 参数 label 设置
            lineWidth: 1,
            data: [],             // 数据序列的数据项
            tooltip: {            // 工具提示
                valueDecimals: 2  // 值的小数点 保留5位
            }
        }
    ]
}

var chart = Chart(cfg)
function main() {
    var ts = 0
    chart.reset()
    while (true) {
        var r = exchange.GetRecords()
        var fisher = calcFisher(r, 0.33, 10)
        if (!r || !fisher) {
            Sleep(500)
            continue
        }

        for (var i = 0; i < r.length; i++){
            if (ts == r[i].Time) {
                chart.add([0,[r[i].Time, r[i].Open, r[i].High, r[i].Low, r[i].Close], -1])
                chart.add([1,[r[i].Time, fisher[i]], -1])
                if (i - 1 >= 0) {
                    chart.add([2,[r[i].Time, fisher[i - 1]], -1])
                }
            }else if (ts < r[i].Time) {
                chart.add([0,[r[i].Time, r[i].Open, r[i].High, r[i].Low, r[i].Close]])
                chart.add([1,[r[i].Time, fisher[i]]])
                if (i - 1 >= 0) {
                    chart.add([2,[r[i].Time, fisher[i - 1]]])
                }
                ts = r[i].Time
            }
        }
    }
}
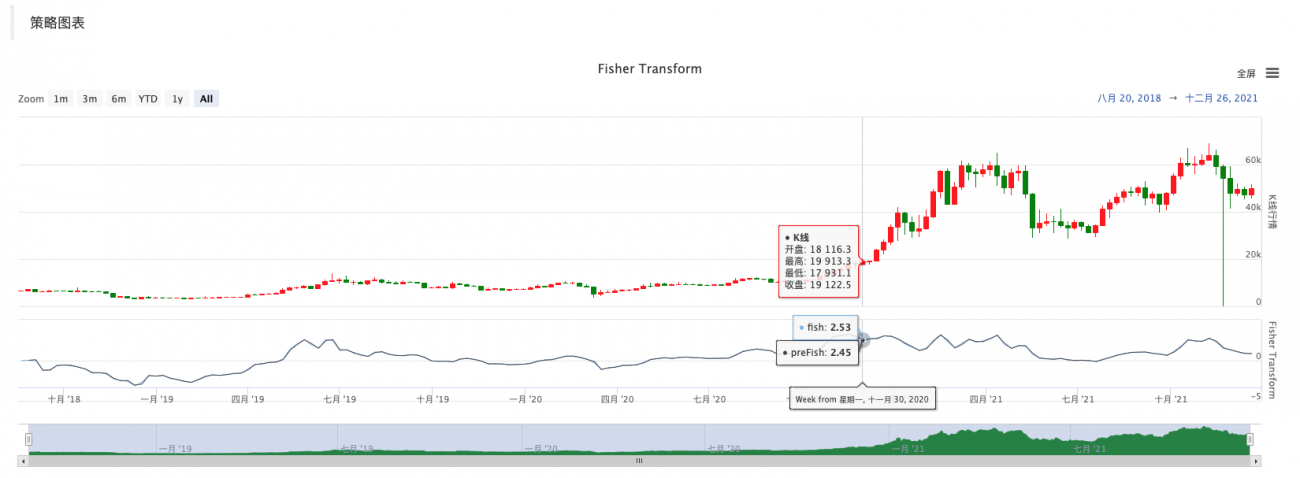
Por lo tanto, es muy conveniente estudiar datos, mostrar gráficos y diseñar estrategias en FMZ.
Este es sólo un punto de partida; tanto profesores como estudiantes pueden dejar comentarios.
- 1