La mejor estrategia de supertendencia
El autor:¿ Qué pasa?, Fecha: 2023-09-09 22:18:31Las etiquetas:
 La estrategia de Supertrend es una estrategia de trading simple y efectiva que se puede utilizar para sacar provecho tanto de los mercados de tendencia alcista como de tendencia bajista.
La mejor estrategia de supertrend es una modificación de la estrategia de supertrend estándar que utiliza un factor y un período más altos.
La estrategia funciona entrando en operaciones largas cuando el precio se rompe por encima de la línea de Supertrend y saliendo de operaciones largas cuando el precio se rompe por debajo de la línea de Supertrend.
La estrategia BEST Supertrend es una estrategia simple y efectiva que puede ser utilizada por operadores de todos los niveles de experiencia.
A continuación se presentan algunos de los beneficios de utilizar la Estrategia BEST Supertrend:
Sencillo y fácil de entender Efectivo tanto en los mercados de tendencia alcista como en los de tendencia bajista Bajo riesgo Rentabilidad Si está buscando una estrategia de trading simple y efectiva, la BEST Supertrend Strategy es una excelente opción. La estrategia es fácil de aprender y usar, y tiene el potencial de generar ganancias tanto en mercados de tendencia alcista como de tendencia bajista.
Aquí hay algunos consejos para usar la mejor estrategia de supertrend:
Utilice un factor y un período altos para que el indicador sea más sensible a los cambios en la tendencia. Utilice las pérdidas de parada para limitar las pérdidas. Comercio con un tamaño pequeño para gestionar el riesgo. Prueba la estrategia en datos históricos para ver cómo funciona. La estrategia BEST Supertrend es una excelente manera de comenzar a operar. Es una estrategia simple y efectiva que puede ser utilizada por operadores de todos los niveles de experiencia. Si usted está buscando una manera de obtener ganancias de los mercados, la estrategia BEST Supertrend es una gran opción.
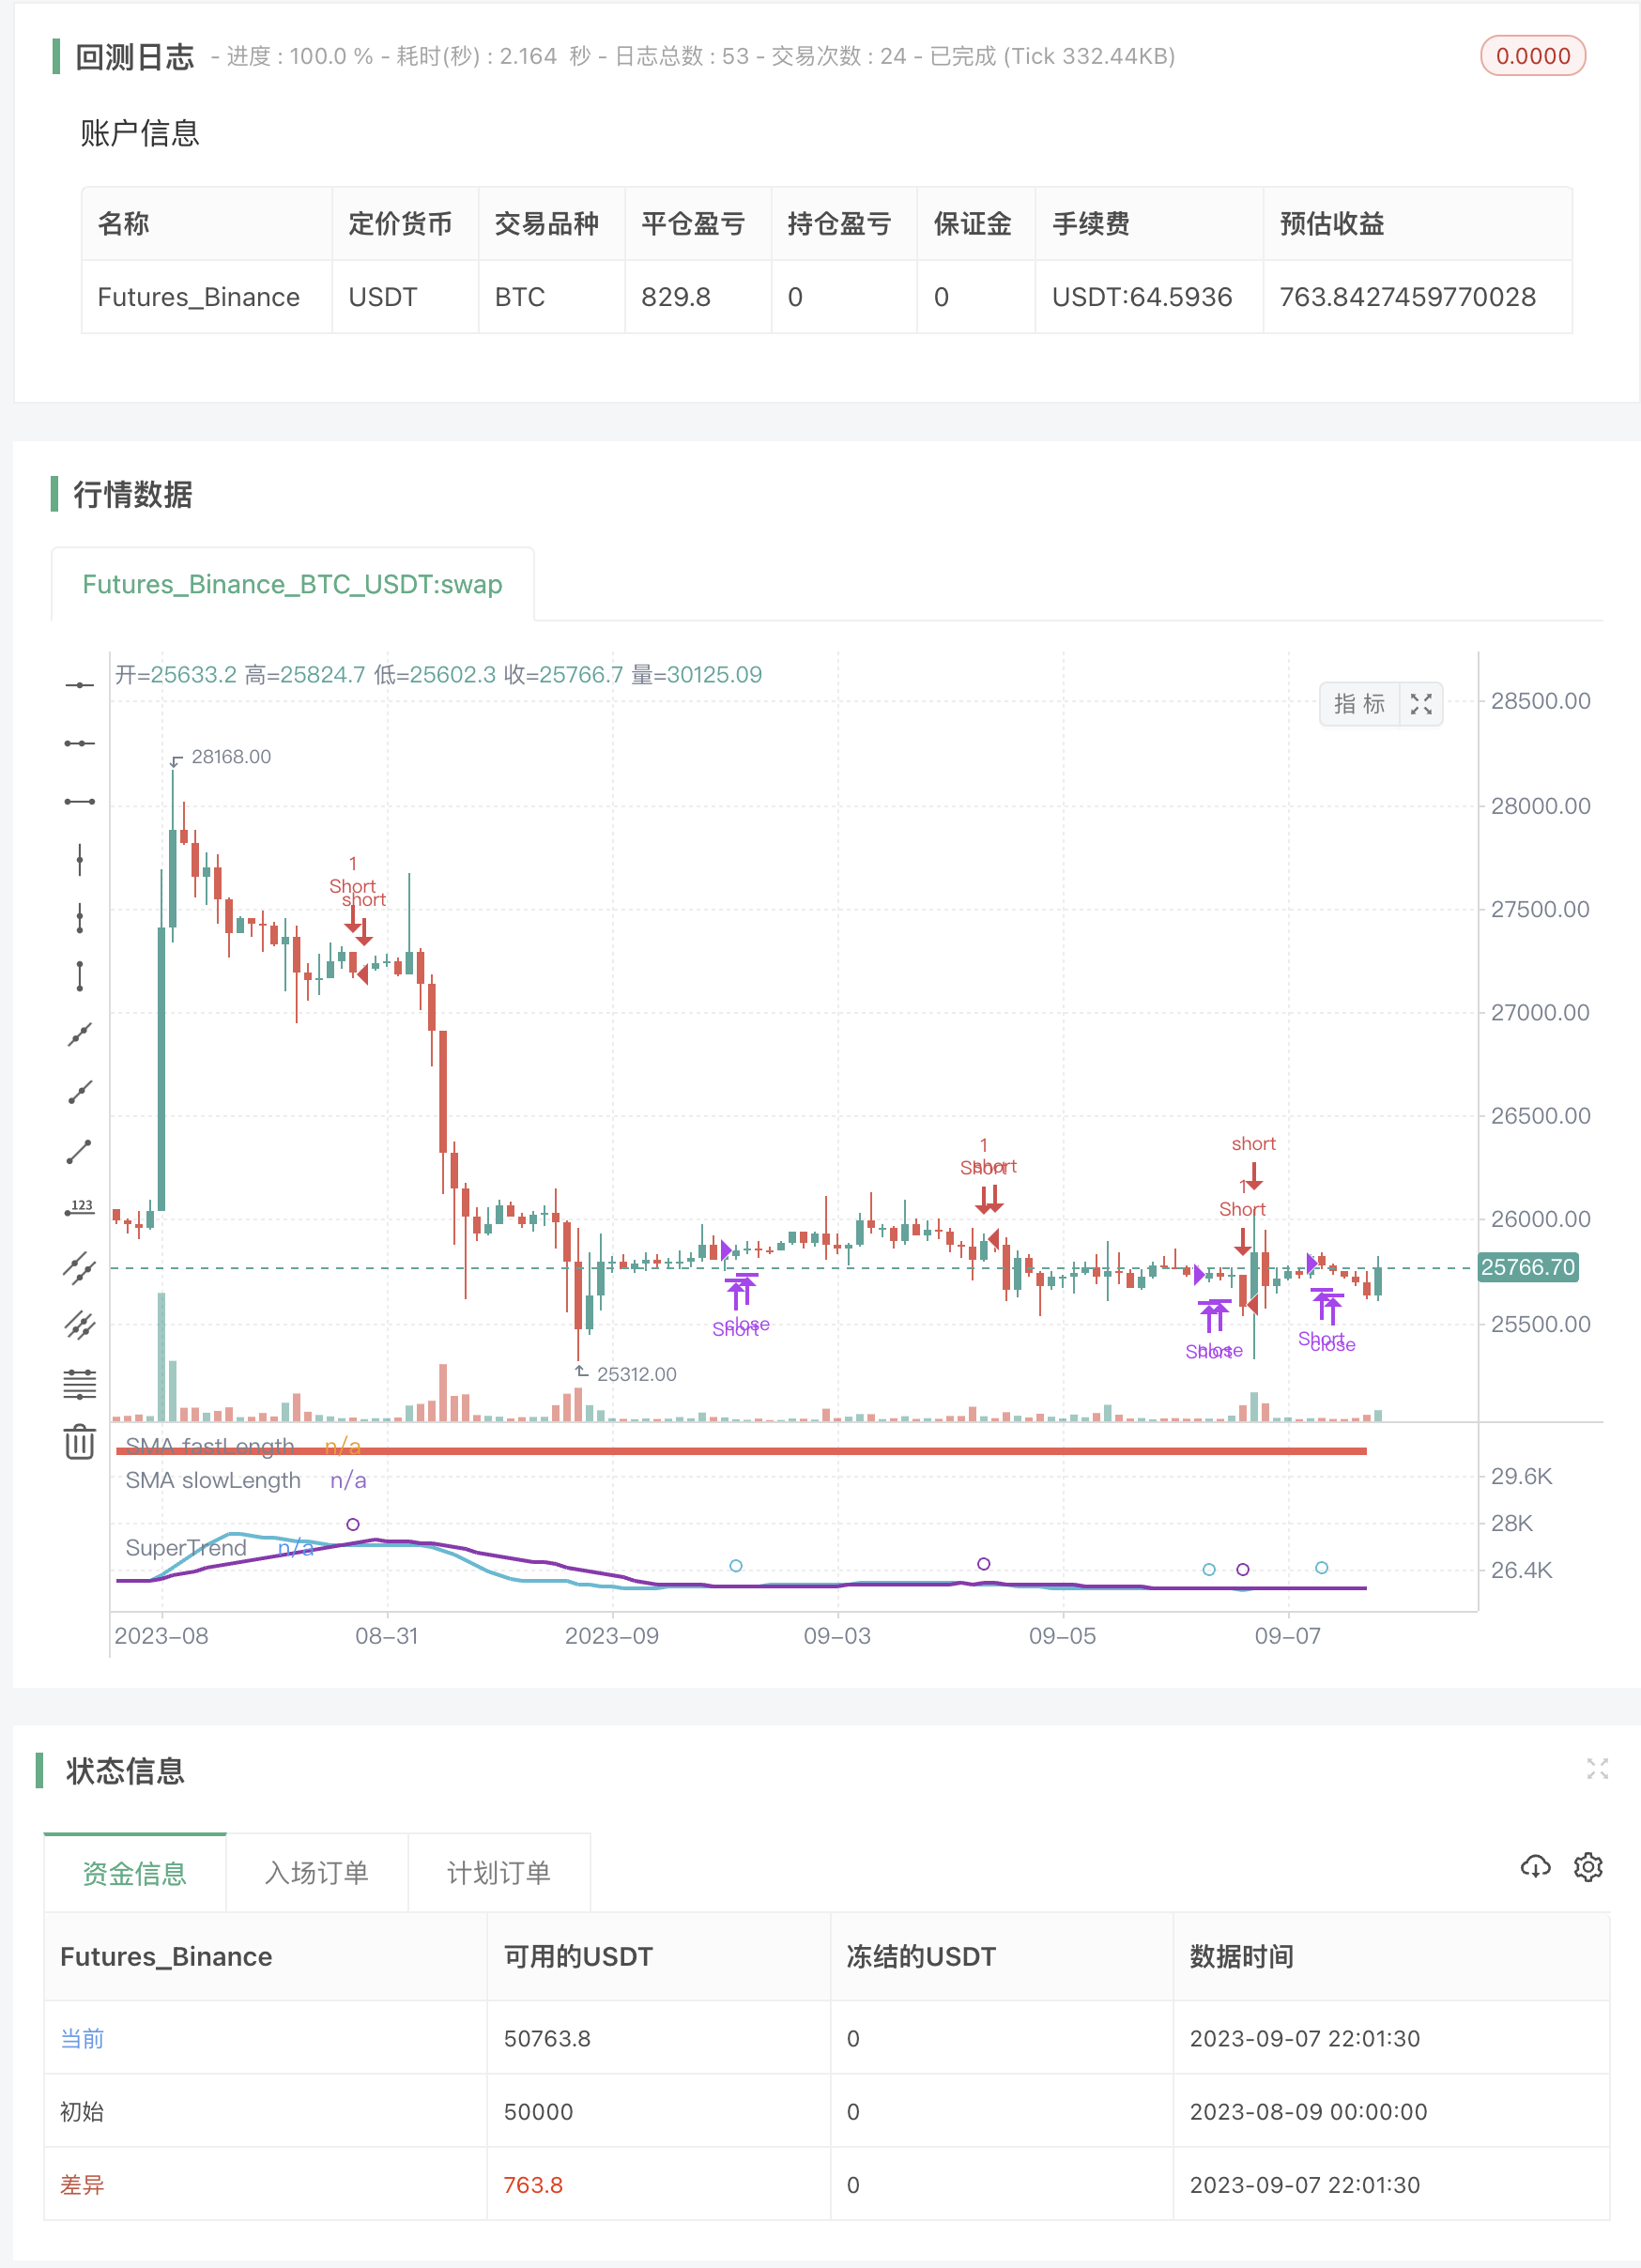
/*backtest
start: 2023-08-09 00:00:00
end: 2023-09-08 00:00:00
period: 2h
basePeriod: 15m
exchanges: [{"eid":"Futures_Binance","currency":"BTC_USDT"}]
args: [["v_input_4",2]]
*/

//@version=4
//@author=Daveatt

// strategy(title="BEST Supertrend Strategy", shorttitle="Supertrend Strategy", overlay=true,
//  pyramiding=0, default_qty_value=100, precision=7, currency=currency.USD,
//  commission_value=0.2,commission_type=strategy.commission.percent, initial_capital=1000000)


///////////////////////////////////////////////////////////////////////////////
///////////////////////////////////////////////////////////////////////////////
/////////////////////////// Strategy Component /////////////////////////////////
///////////////////////////////////////////////////////////////////////////////
///////////////////////////////////////////////////////////////////////////////

orderType = input("Longs+Shorts",title="What type of Orders", options=["Longs+Shorts","LongsOnly","ShortsOnly"])
isLong   = (orderType != "ShortsOnly")
isShort  = (orderType != "LongsOnly")

// SMA
fastLength = input(7, title="Fast Length SMA")
slowLength = input(20, title="Slow Length SMA")

///////////////////////////////////////////////////////////////////////////////
///////////////////////////////////////////////////////////////////////////////
///////////////////////////// SUPERTREND /////////////////////////////////////
///////////////////////////////////////////////////////////////////////////////
///////////////////////////////////////////////////////////////////////////////

Factor=input(3,title="[ST] Factor", minval=1,maxval = 100, type=input.float)
Pd=input(3, title="[ST] PD", minval=1,maxval = 100)
TF=input("daily", title="Supertrend timeframe", options=["daily","weekly","monthly","quartly","yearly"])

//////////////////////////
//* COLOR CONSTANTS *//
//////////////////////////

AQUA = #00FFFFFF
BLUE = #0000FFFF
RED  = #FF0000FF
LIME = #00FF00FF
GRAY = #808080FF
DARKRED   = #8B0000FF
DARKGREEN = #006400FF
GOLD = #FFD700
WHITE = color.white

// Plots
GREEN_LIGHT     = color.new(color.green, 40)
RED_LIGHT       = color.new(color.red, 40)
BLUE_LIGHT      = color.new(color.aqua, 40)
PURPLE_LIGHT    = color.new(color.purple, 40)


///////////////////////////////////////////////////////////////////////////////
///////////////////////////////////////////////////////////////////////////////
/////////////////////// SUPERTREND DETECTION //////////////////////////////////
///////////////////////////////////////////////////////////////////////////////
///////////////////////////////////////////////////////////////////////////////

f_supertrend(Factor, Pd) =>

    Up=hl2-(Factor*atr(Pd))
    Dn=hl2+(Factor*atr(Pd))

    TrendUp = 0.0
    TrendUp := close[1]>TrendUp[1] ? max(Up,TrendUp[1]) : Up
    TrendDown = 0.0
    TrendDown := close[1]<TrendDown[1]? min(Dn,TrendDown[1]) : Dn
    Trend = 0.0
    Trend := close > TrendDown[1] ? 1: close< TrendUp[1]? -1: nz(Trend[1],1)
    Tsl = Trend==1? TrendUp: TrendDown

    Tsl

st_tsl = f_supertrend(Factor, Pd)

///////////////////////////////////////////////////////////////////////////////
///////////////////////////////////////////////////////////////////////////////
////////////////////////// MULTI TIMEFRAMES CALCS /////////////////////////////
///////////////////////////////////////////////////////////////////////////////
///////////////////////////////////////////////////////////////////////////////


f_securitys(_ticker, _source)=>

    daily = security(_ticker, 'D', _source[1], lookahead=true)
    weekly = security(_ticker, 'W', _source[1], lookahead=true)
    montly = security(_ticker, 'M', _source[1], lookahead=true)
    quarterly = security(_ticker, '3M', _source[1], lookahead=true)
    yearly = security(_ticker, '12M', _source[1], lookahead=true)

    [daily, weekly, montly, quarterly, yearly]


[st_daily, st_weekly, st_monthly, st_quarterly, st_yearly] = f_securitys(syminfo.tickerid, st_tsl)

lapos_x = timenow + round(change(time)*50)
lapos_y = close

down_arrows_text = "▼" + " " + "▼" + " " + "▼" + " " + "▼" + " " + "▼" + " " + "▼" + " " + "▼" + "\n"

// Drawing function designed by RicardoSantos.
f_draw_infopanel(_x, _y, _color, _line, _text)=>
    _rep_text = ""
    for _l = 0 to _line
        _rep_text := _rep_text + "\n"
    _rep_text := _rep_text + _text

    var label _la = na
    label.delete(_la)
    _la := label.new(x=_x, y=_y, text=_rep_text, xloc=xloc.bar_time, yloc=yloc.price,
     color=#C1CADE,  textcolor=_color, size=size.normal)

// Using the JustUncleL reverse order trick
f_draw_infopanel(lapos_x, lapos_y, color.olive,                 12, "╚═══════════════════════╝")
f_draw_infopanel(lapos_x, lapos_y, color.new(color.red, 20),    10,  "Yearly : " + tostring(round(st_yearly)))
f_draw_infopanel(lapos_x, lapos_y, color.new(color.purple, 20), 8,  "Quarterly : " + tostring(round(st_quarterly)))
f_draw_infopanel(lapos_x, lapos_y, color.new(color.green, 20),  6,  "Monthly : " + tostring(round(st_monthly)))
f_draw_infopanel(lapos_x, lapos_y, color.new(color.blue, 20),   4,  "Weekly : " +  tostring(round(st_weekly)))
f_draw_infopanel(lapos_x, lapos_y, color.new(color.green, 20),  2,  "Daily : " +  tostring(round(st_daily)))
f_draw_infopanel(lapos_x, lapos_y, color.olive,                 0,  "╔═════ Supertrend (" + tostring(Factor) + "," + tostring(Pd) + ") ═════╗")

IS_DAILY = TF == "daily"
IS_WEEKLY = TF == "weekly"
IS_MONTHLY = TF == "monthly"
IS_QUARTERLY = TF == "quarterly"
IS_YEARLY = TF == "yearly"

// select right supertrend
st_tsl_TF = iff(IS_DAILY, st_daily,
 iff(IS_WEEKLY, st_weekly,
 iff(IS_MONTHLY, st_monthly,
 iff(IS_QUARTERLY, st_quarterly,
 iff(IS_YEARLY, st_yearly, st_daily)))))


// hard exit
sma_fast = sma(close, fastLength)
sma_slow = sma(close, slowLength)
long_exit     = crossunder(sma_fast,sma_slow)
short_exit    = crossover(sma_fast,sma_slow)

// MA Cross
curr = 0 - barssince(long_exit) + barssince(short_exit)
cross_buy = curr < 0 ?  1 : 0
cross_sell = curr > 0 ? 1  : 0

bull = close >= st_tsl_TF and cross_buy
bear = close <= st_tsl_TF and cross_sell
entry_price = valuewhen(bull or bear, close, 0)

plot(sma_fast, "SMA fastLength", color=color.aqua, linewidth=2)
plot(sma_slow, "SMA slowLength", color=color.purple, linewidth=2)
plotshape(crossover(sma_fast,sma_slow), color=color.aqua, style=shape.circle, size=size.small)
plotshape(crossunder(sma_fast,sma_slow), color=color.purple, style=shape.circle, size=size.small)

// Plot the ST
linecolor = close >= st_tsl_TF ? color.green : color.red
plot(st_tsl_TF, color = linecolor , linewidth = 4,title = "SuperTrend", transp=0)

// Strategy entries/exits
if isLong
    strategy.entry("Long", 1, when=bull)
    strategy.close("Long", when=long_exit)

if isShort
    strategy.entry("Short", 0,  when=bear)
    strategy.close("Short", when=short_exit )
- Estrategia del sistema de negociación de tendencia al alza y sobreventa de índices
- Estrategia de negociación de tendencias cuantitativas utilizando regresión polinomial
- Combo Backtest 123 Reversión y índice de volatilidad relativa
- La estrategia de negociación de la SMA-3
- Estrategia de negociación automatizada de la banda de Bollinger
- La estrategia de comercio cruzado Genesis
- La estrategia de las bandas de pistoleros
- Estrategia de negociación de pares
- La estrategia de gama abierta con objetivo de ganancia dinámica
- Apremiar el impulso en la estrategia de reversión
- Sistema de reversión
- Estrategia EMA adaptativa con retraso cero
- Nube de ICHIMOKU de BV - Todas las señales
- Estrategia del índice de fortaleza relativa
- Las bandas de Bollinger + EMA 9
- Se trata de la suma de los valores de las acciones de los bancos centrales de la Unión.
- NTPCretraso del servidor de UDP y Exchange
- VWMA + SMA Bollinger Bands + Estrategia RSI: análisis de la correlación entre precio y volumen
- EMA200 y Estrategia del RSI estocástico
- Trade05-K línea de soporte de resistencia + ATR paralizo