Estrategia de predicción del cruce de volatilidad dinámica del MACD

Descripción general
La estrategia se basa en el MACD para tomar decisiones de negociación. El núcleo de la estrategia es predecir los posibles forks y deadlines mediante la observación de las tendencias cambiantes en el gráfico de columnas MACD. La estrategia no se centra solo en las señales de cruce de los indicadores MACD tradicionales, sino en las características de cambio dinámico de los gráficos de columnas.
Principio de estrategia
La estrategia utiliza una versión mejorada del sistema de indicadores MACD, que contiene el cálculo de la diferencia entre el promedio móvil rápido (EMA12) y el promedio móvil lento (EMA26), y una línea de señal basada en 2 ciclos. La lógica de negociación central se basa en los siguientes puntos clave:
- El cambio dinámico de la tendencia se determina calculando la tasa de cambio (hist_change) en el gráfico columnar
- Cuando el gráfico de columnas es negativo y presenta una tendencia al alza durante tres períodos consecutivos, el pronóstico puede dar lugar a una señal de horquilla de oro, para entrar más temprano.
- Cuando el gráfico de columnas es positivo y presenta una tendencia a la baja durante tres períodos consecutivos, el pronóstico puede dar lugar a una señal de horquilla muerta y una salida a la par.
- Introducción de un mecanismo de filtro de tiempo para las estrategias que solo operan en un período de tiempo determinado
Ventajas estratégicas
- Señales de predicción: predicción anticipada de posibles señales de cruce mediante la observación de cambios dinámicos en el gráfico de columnas, lo que mejora el tiempo de entrada
- El control de riesgo es razonable: se establece una comisión del 0.1% y un costo de transacción de 3 puntos de deslizamiento, en consonancia con el entorno de transacción real
- Flexibilidad en la gestión de fondos: porcentaje del valor total de la cuenta para la gestión de posiciones y el control efectivo del riesgo
- Excelente visualización: gráficos columnares en diferentes colores y señalamiento de señales de negociación con flechas para facilitar el análisis
Riesgo estratégico
- Riesgo de brechas falsas: señales de brechas falsas que pueden ser frecuentes en mercados de oscilación horizontal
- Riesgo de retraso: el MACD en sí mismo es algo retrasado a pesar de la adopción de mecanismos de prejuicio
- Dependencia del entorno del mercado: las estrategias funcionan mejor en mercados con una tendencia clara, y pueden funcionar peor en mercados convulsos
- Sensibilidad de los parámetros: la configuración del ciclo de línea rápida y lenta tiene un mayor impacto en el rendimiento de la estrategia
Dirección de optimización de la estrategia
- Introducción de filtros de entornos de mercado: se pueden agregar indicadores de tendencia para usar diferentes parámetros de negociación en diferentes entornos de mercado
- Optimización de la gestión de posiciones: el porcentaje de tenencia se puede ajustar dinámicamente según la intensidad de la señal
- Mecanismo de parada de pérdidas mejorado: agregado de parada de seguimiento o parada fija para controlar la retirada
- Mecanismos de confirmación de señales: verificación cruzada con otros indicadores técnicos para mejorar la fiabilidad de la señal
- Optimización de la selección de parámetros: se puede utilizar el método de parámetros de adaptación para ajustar los parámetros del indicador en función de la dinámica de la situación del mercado
Resumir
La estrategia mejora y optimiza el sistema de negociación MACD tradicional mediante la aplicación innovadora de las características de cambio dinámico del gráfico de columnas MACD. El mecanismo de predeterminación de la estrategia permite proporcionar señales de entrada más tempranas, mientras que las estrictas condiciones de negociación y las medidas de control de riesgo aseguran la estabilidad de la estrategia.
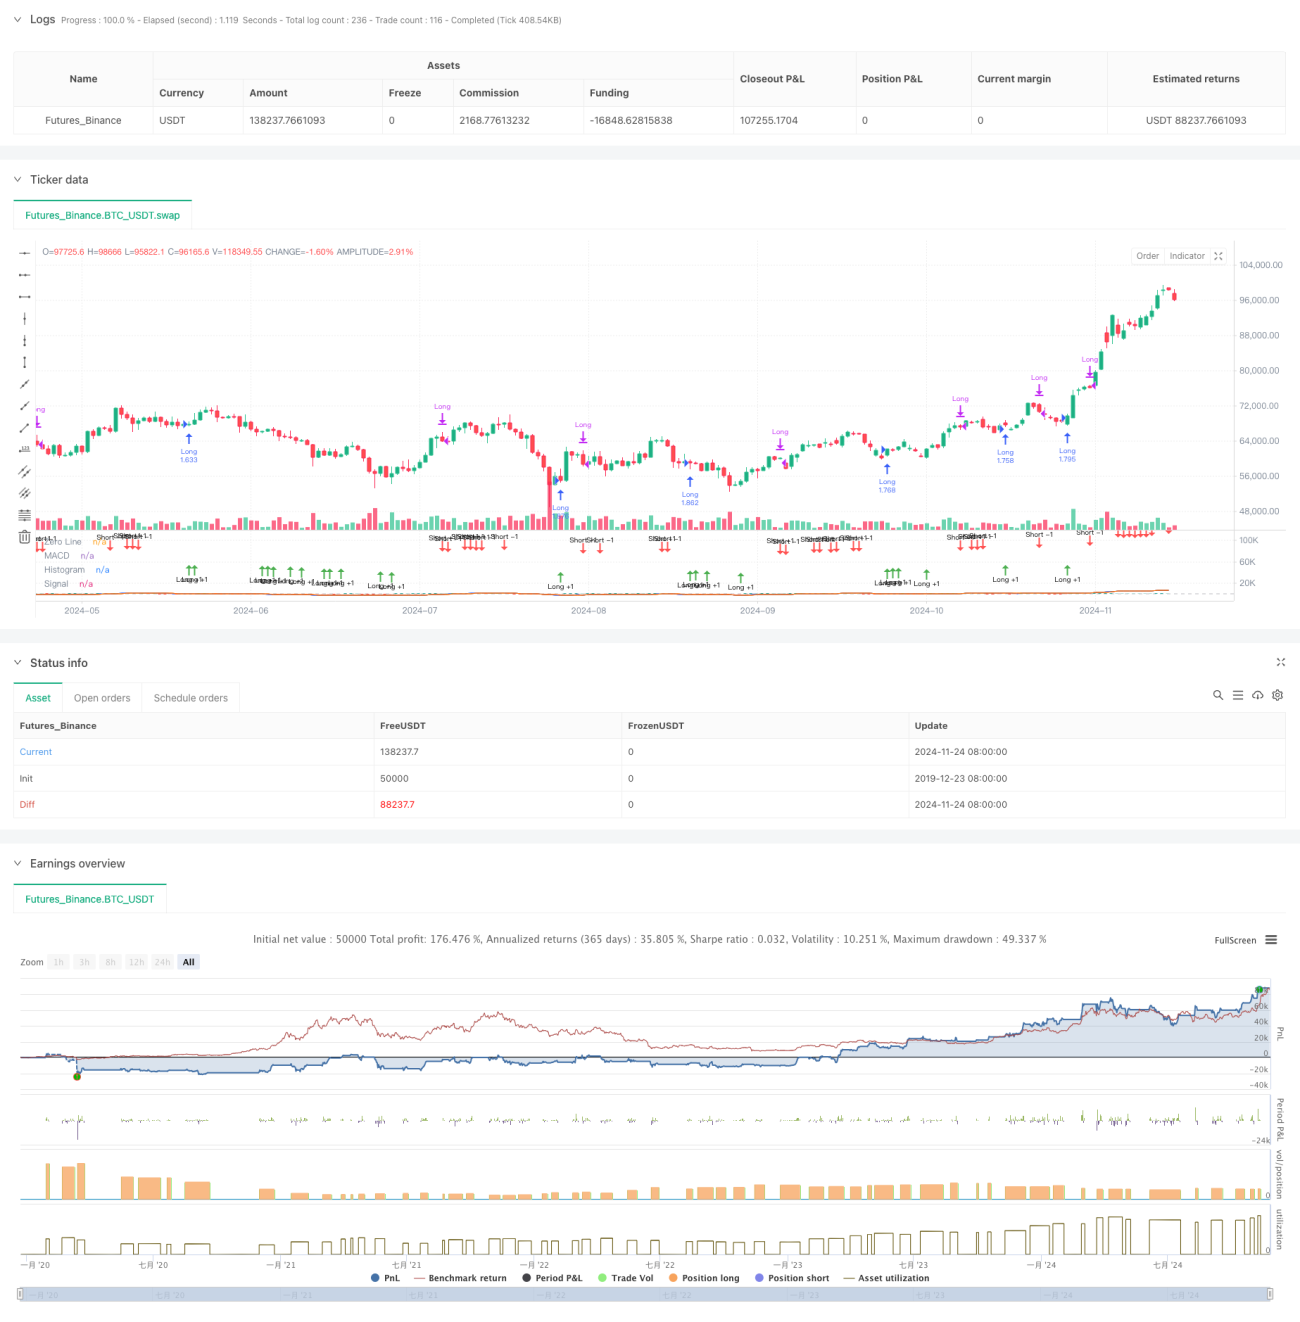
/*backtest
start: 2019-12-23 08:00:00
end: 2024-11-25 08:00:00
period: 1d
basePeriod: 1d
exchanges: [{"eid":"Futures_Binance","currency":"BTC_USDT"}]
*/

//@version=5
strategy(title="Demo GPT - Moving Average Convergence Divergence", shorttitle="MACD", commission_type=strategy.commission.percent, commission_value=0.1, slippage=3, default_qty_type=strategy.percent_of_equity, default_qty_value=100)

// Getting inputs- 1