
Descripción general
Esta estrategia es una estrategia comercial cuantitativa que combina el seguimiento de tendencias y mecanismos de salida temporal. El núcleo de la estrategia es capturar las tendencias del mercado observando la relación entre el precio y el promedio móvil de 60 días, introduciendo al mismo tiempo un mecanismo de liquidación forzada de fin de año para controlar los riesgos. Cuando el precio de cierre rompe la media móvil de 60 días y la pendiente de la media móvil es positiva, ingrese al mercado para comprar y cierre todas las posiciones el último día de negociación de cada año.
Principio de estrategia
La estrategia se basa en los siguientes elementos centrales:
- Juicio de tendencia: utilice el promedio móvil simple (SMA) de 60 días como indicador para determinar la tendencia a mediano plazo y confirme la dirección de la tendencia calculando la pendiente del promedio móvil de 14 días.
- Señal de entrada: cuando el precio rompe la media móvil de 60 días hacia arriba y la pendiente de la media móvil es positiva, indica que el mercado puede entrar en una tendencia alcista y en este momento se genera una señal de compra.
- Mecanismo de salida: La estrategia adopta un mecanismo de salida de tiempo fijo y cierra todas las posiciones el último día de negociación de cada año. Este mecanismo puede evitar eficazmente el riesgo de mantener posiciones a lo largo de años.
- Gestión del tiempo de negociación: la estrategia tiene funciones integradas de control de rango de fechas de negociación y de evaluación de días de negociación para garantizar que las operaciones se realicen solo en días de negociación válidos.
Ventajas estratégicas
- Fuerte capacidad de seguimiento de tendencias: el sistema de promedio móvil puede capturar eficazmente las tendencias de mediano y largo plazo y aprovechar al máximo las oportunidades de tendencias del mercado.
- Control perfecto del riesgo: El mecanismo de liquidación forzosa al final del año puede controlar eficazmente el riesgo de mantener posiciones y evitar la incertidumbre causada por mantener posiciones a lo largo de los años.
- Reglas de operación claras: Las condiciones de entrada y salida son claras y fáciles de ejecutar y probar.
- Buena adaptabilidad: Los parámetros de la estrategia son altamente ajustables y pueden optimizarse según las diferentes características del mercado.
Riesgo estratégico
- Histéresis de la media móvil: La media móvil tiene una cierta histéresis, que puede provocar un ligero retraso en el momento de entrada.
- No aplicable en un mercado lateral y volátil: en un mercado lateral y volátil, pueden producirse frecuentes señales de ruptura falsas.
- Riesgo de liquidación fijo: La liquidación forzada al final del año puede resultar en una salida anticipada en una buena tendencia.
- Sensibilidad de los parámetros: el efecto de la estrategia es sensible a la configuración de los parámetros, como el período del promedio móvil.
Dirección de optimización de la estrategia
- Agregar indicadores de confirmación de tendencia: se pueden introducir indicadores como RSI y MACD para ayudar a evaluar las tendencias y mejorar la precisión del ingreso al mercado.
- Optimice el mecanismo de salida: puede agregar condiciones de stop-loss y take-profit, y no dependa completamente del tiempo para salir.
- Parámetros de ajuste dinámico: El período del promedio móvil se puede ajustar dinámicamente según la volatilidad del mercado.
- Aumentar la gestión de posiciones: introducir indicadores como el ATR para el control de posiciones para mejorar la eficiencia del uso del capital.
Resumir
Esta estrategia construye un sistema comercial relativamente sólido al combinar el seguimiento de tendencias y la gestión del tiempo. La lógica de la estrategia es simple y clara, fácil de entender e implementar y tiene buena practicidad. Se espera que mediante una optimización razonable de parámetros y la complementación de medidas de control de riesgos, esta estrategia logre rendimientos estables en las transacciones reales.
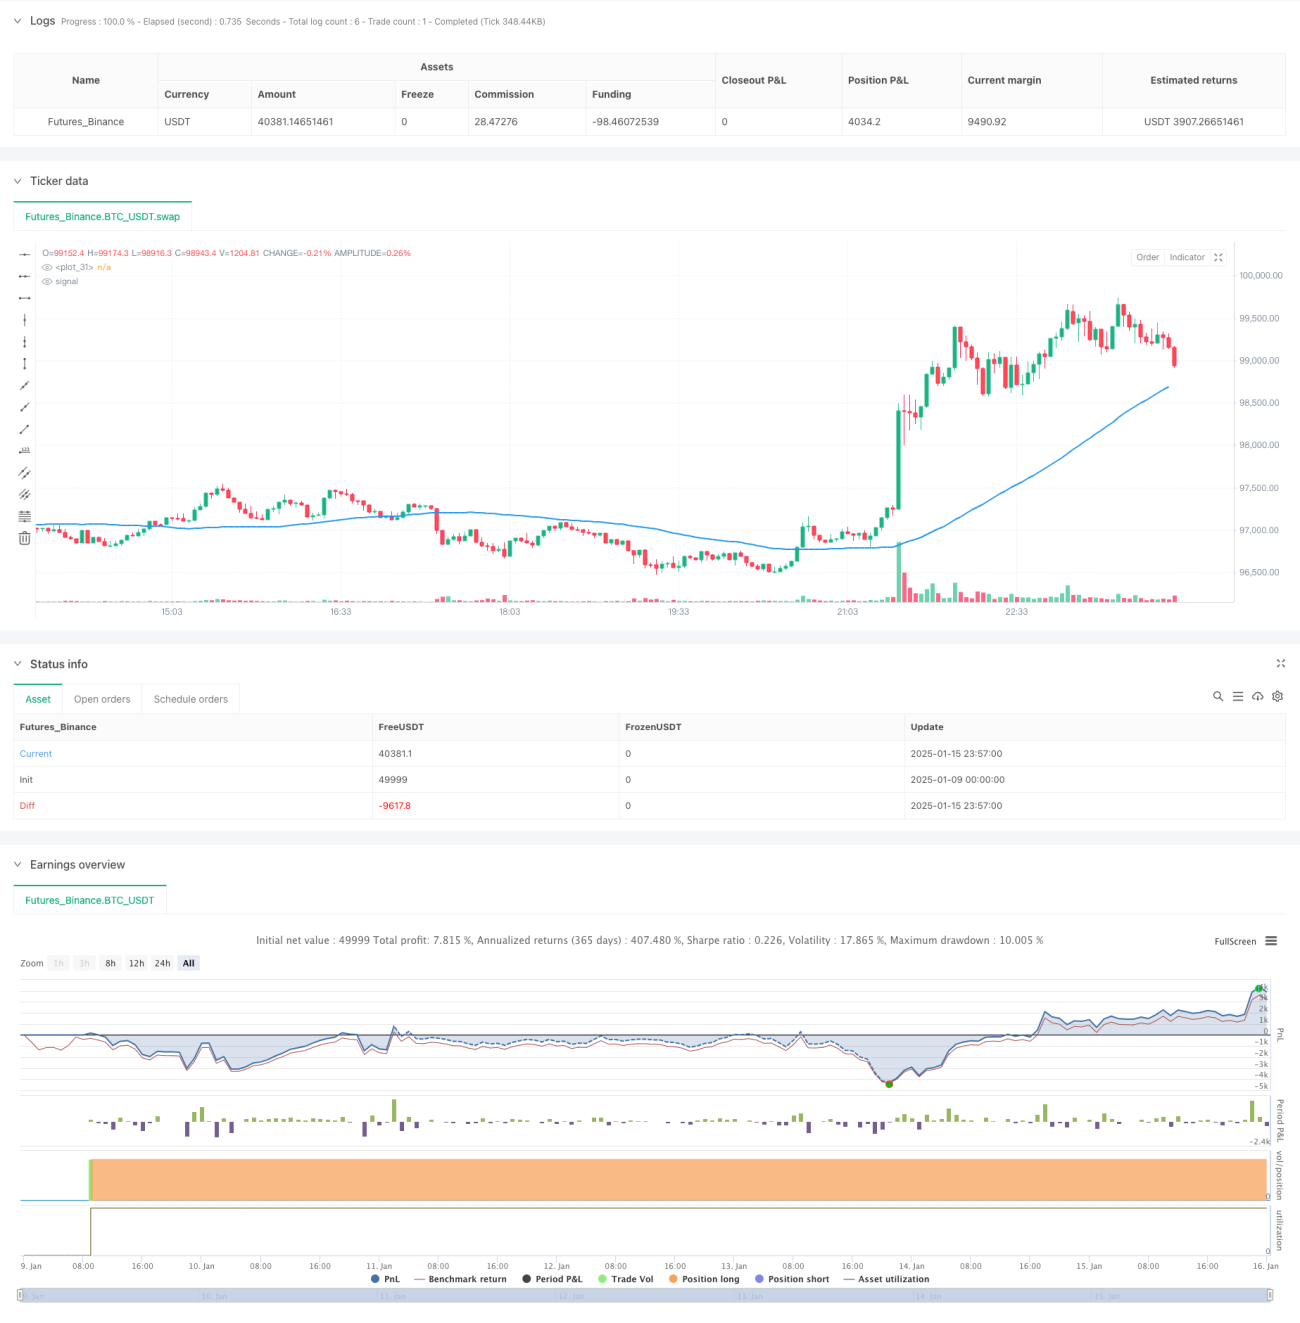
/*backtest
start: 2025-01-09 00:00:00
end: 2025-01-16 00:00:00
period: 3m
basePeriod: 3m
exchanges: [{"eid":"Futures_Binance","currency":"BTC_USDT","balance":49999}]
*/

//@version=5
strategy("Buy above 60-day MA, Sell at year-end", overlay=true, pyramiding=1)

// Define inputs for start and end dates- 1