
Resumen
Esta es una estrategia de trading cuantitativa que combina el Índice de Fuerza Relativa (RSI) y múltiples medias móviles. La estrategia determina principalmente las tendencias del mercado monitoreando las señales de cruce de diferentes tipos de medias móviles (incluyendo SMA, EMA, WMA y SMMA) en el indicador RSI, al mismo tiempo que utiliza las zonas de sobrecompra y sobreventa del propio RSI como criterio auxiliar para identificar los momentos de entrada y salida.
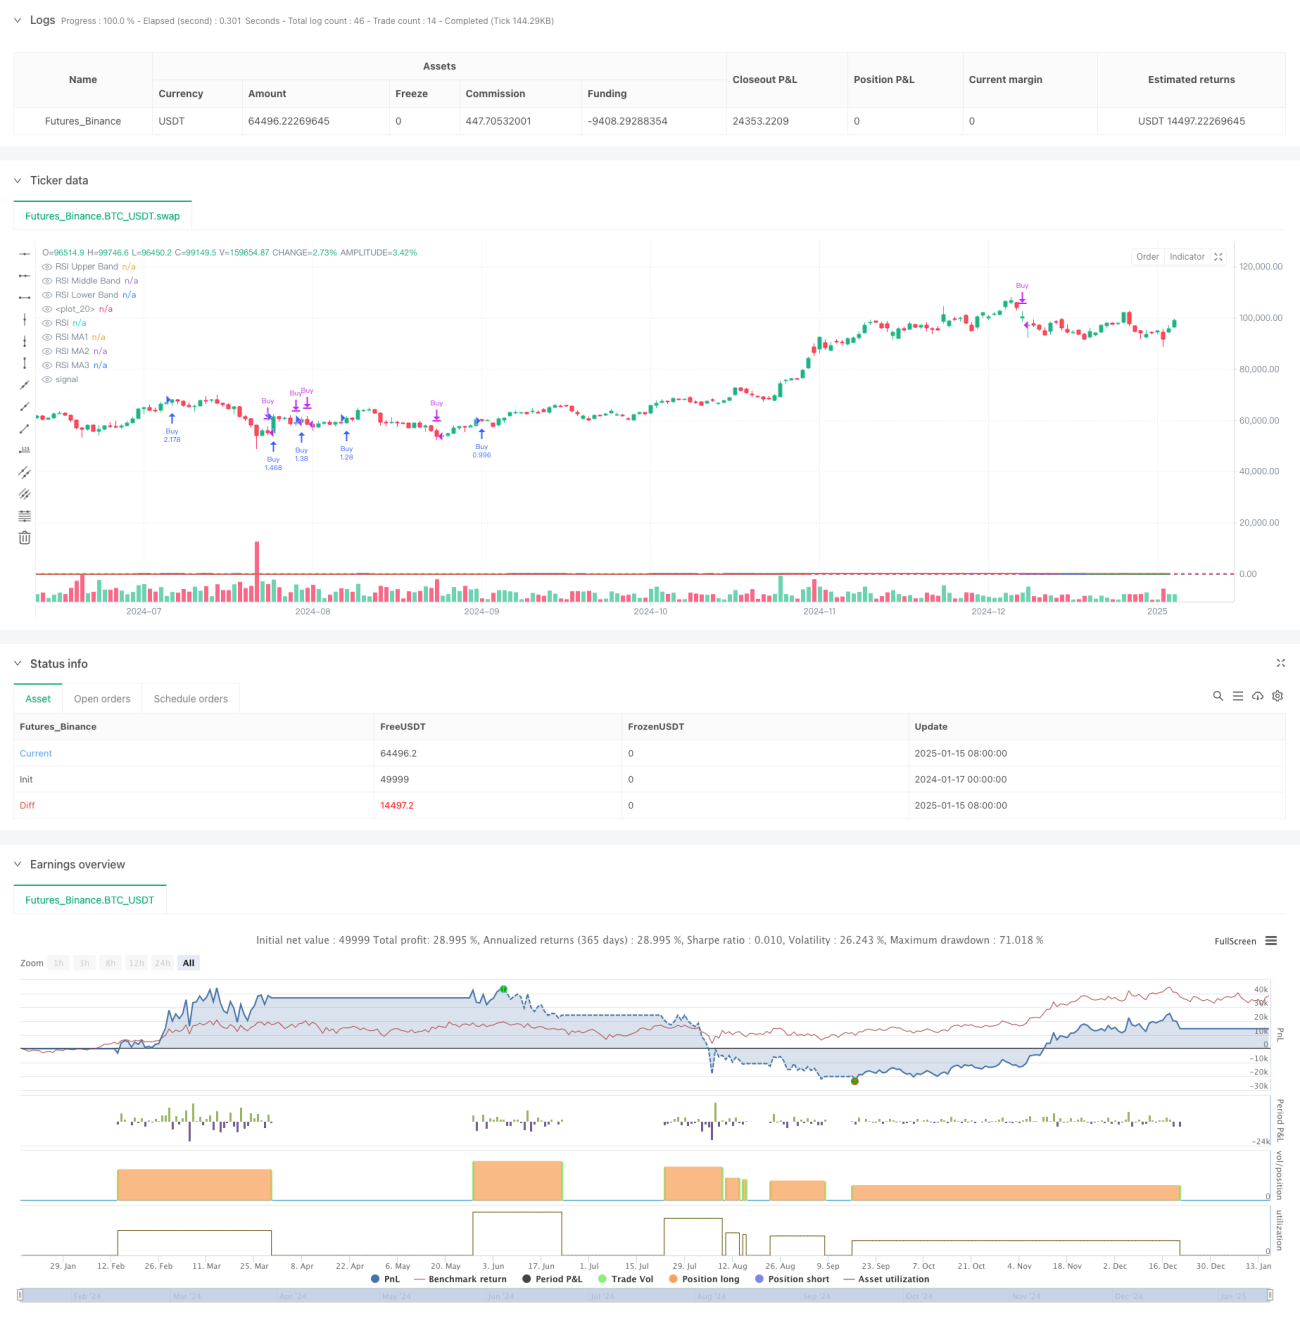
Principio de la Estrategia
La estrategia incluye los siguientes pasos clave de cálculo:
- Calcular el RSI de 14 períodos, estableciendo la zona de sobrecompra en 70 y la zona de sobreventa en 30.
- Calcular tres medias móviles con diferentes parámetros en la curva del RSI:
- MA1: 20 períodos, opcional SMA/EMA/WMA/SMMA
- MA2: 50 períodos, opcional SMA/EMA/WMA/SMMA
- MA3: 100 períodos, opcional SMA/EMA/WMA/SMMA
- Reglas de generación de señales de trading:
- Señal de compra: cuando MA2 cruza por encima de MA3
- Señal de venta: cuando MA2 cruza por debajo de MA3
- Detectar simultáneamente las divergencias del RSI para proporcionar referencias auxiliares en la toma de decisiones de trading.
Ventajas de la Estrategia
- Validación cruzada de múltiples indicadores técnicos, mejorando la fiabilidad de las señales de trading.
- Tipo y parámetros de medias móviles ajustables, ofreciendo gran flexibilidad.
- La función de detección de divergencias del RSI puede ayudar a identificar puntos de inflexión del mercado con antelación.
- Gestión de posición basada en porcentaje, controlando eficazmente el riesgo.
- Excelente visualización, facilitando el análisis y el backtesting.
Riesgos de la Estrategia
- Los cruces de medias móviles pueden generar efectos de retardo.
- En mercados laterales o de rango, pueden producirse señales falsas frecuentes.
- El indicador RSI puede distorsionarse en ciertas condiciones del mercado.
- La elección inadecuada de parámetros puede provocar señales de trading excesivas o insuficientes.
Medidas de mitigación:
- Se recomienda realizar una validación cruzada con la tendencia del mercado y el volumen de operaciones.
- Se pueden ajustar los parámetros de las medias móviles para optimizar la frecuencia de las operaciones.
- Establecer stop-loss y take-profit para controlar el riesgo.
Direcciones de Optimización de la Estrategia
- Optimización del filtrado de señales:
- Añadir indicadores de confirmación de tendencia.
- Incorporar análisis de volumen.
- Optimización dinámica de parámetros:
- Ajustar automáticamente los parámetros del RSI y las medias móviles según la volatilidad del mercado.
- Introducir métodos de cálculo de período adaptativo.
- Optimización del control de riesgos:
- Desarrollar mecanismos dinámicos de stop-loss y take-profit.
- Diseñar sistemas de gestión dinámica del tamaño de la posición.
Conclusión
Esta estrategia construye un sistema de trading con alta adaptabilidad combinando el RSI y múltiples medias móviles. La principal ventaja de la estrategia reside en la validación cruzada de múltiples indicadores técnicos y la configuración flexible de parámetros. Sin embargo, es necesario tener en cuenta el retardo de las medias móviles y la influencia de las condiciones del mercado en el rendimiento de la estrategia. Mediante una optimización continua y un control de riesgos adecuado, esta estrategia tiene el potencial de lograr un rendimiento estable en el trading real.
/*backtest
start: 2024-01-17 00:00:00
end: 2025-01-16 00:00:00
period: 1d
basePeriod: 1d
exchanges: [{"eid":"Futures_Binance","currency":"BTC_USDT","balance":49999}]
*/

//@version=6
strategy(title="Relative Strength Index with MA Strategy", shorttitle="RSI-MA Strategy", overlay=true, default_qty_type=strategy.percent_of_equity, default_qty_value=200)

// RSI Inputs- 1