EMA inFusion Pro Estrategia de fusión de datos de múltiples fuentes

🎯 Punto clave de la estrategia: no es solo una estrategia EMA que observa el precio
¿Sabías que la mayoría de la gente solo usa la EMA para ver el precio? Pero, ¿qué hace que esta estrategia sea tan poderosa? ¡Puede calcular la EMA a partir de 6 fuentes de datos diferentes! Es como cocinar, no solo usando sal, sino también azúcar, vinagre y salsa de soja, brindándote señales de trading más ricas.
¡Punto clave! Estas 6 fuentes de datos incluyen: precio ordinario, volumen, tasa de cambio, precio promedio de la vela, volumen promedio de la vela y tasa de cambio promedio de la vela. ¡Cada una tiene una percepción diferente del mercado!
📊 Sistema de filtro triple: señales más precisas
Esta estrategia no da señales al azar. Tiene tres "controles de seguridad":
Primero: Juicio de tendencia EMA 📈
Como mirar el pronóstico del tiempo, primero determina si la dirección general es despejada o lluviosa
Segundo: Filtro de intensidad ADX 💪
El ADX es como un instrumento que mide la fuerza del viento. Solo emite una señal cuando la tendencia es lo suficientemente fuerte (por defecto por encima de 25). ¡Evita recibir golpes de ida y vuelta en mercados laterales!
Tercero: Confirmación de volumen 🔊
Un aumento repentino del volumen es como si la acción "hablara en voz alta", demostrando que esta señal es seria, no una broma
🎮 Tres modos de salida: adaptados a diferentes estilos de trading
Lo más considerado es que esta estrategia ofrece 3 formas de salida, como en un juego con dificultades fácil, normal y difícil:
Modo 1: Salida por señal inversa 🔄
El más simple y directo: cuando aparece una señal alcista, cierra cortos y abre largos; cuando aparece una señal bajista, cierra largos y abre cortos
Modo 2: Stop dinámico ATR 📏
Se ajusta automáticamente según la volatilidad del mercado: cuando la volatilidad es alta, el stop se amplía; cuando es baja, se reduce
Modo 3: Stop fijo porcentual 📊
El más fácil de entender: toma ganancias del 2%, corta pérdidas del 1.5% (personalizable)
🚀 Recomendaciones prácticas de aplicación
Ciclo adecuado: Trading a corto/medio plazo, especialmente adecuado para mercados con cierta volatilidad
Guía para evitar errores: Ten cuidado en mercados laterales, se recomienda activar el filtro ADX
Jugada avanzada: Puedes probar diferentes fuentes de datos; la fuente de volumen es especialmente efectiva en rupturas con aumento de volumen
La mayor ventaja de esta estrategia es su gran flexibilidad. Puedes elegir la fuente de datos y el modo de salida más adecuados según las diferentes condiciones del mercado. Recuerda, no existe una estrategia perfecta, solo la más adecuada para el mercado actual.
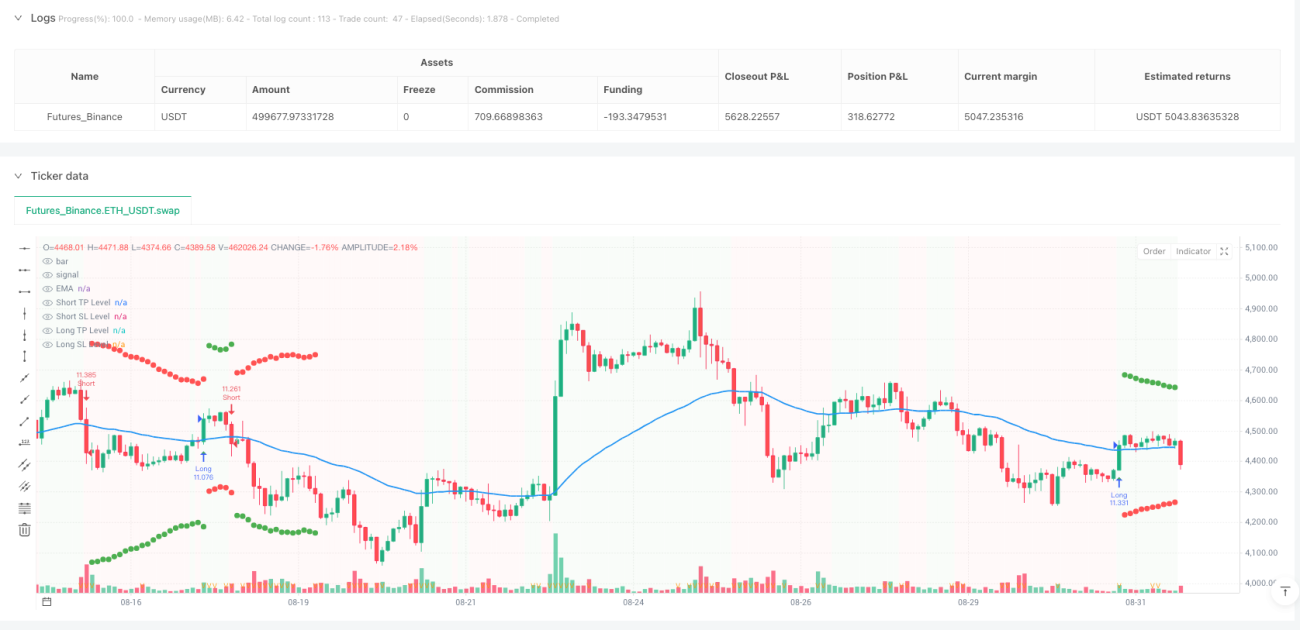
/*backtest
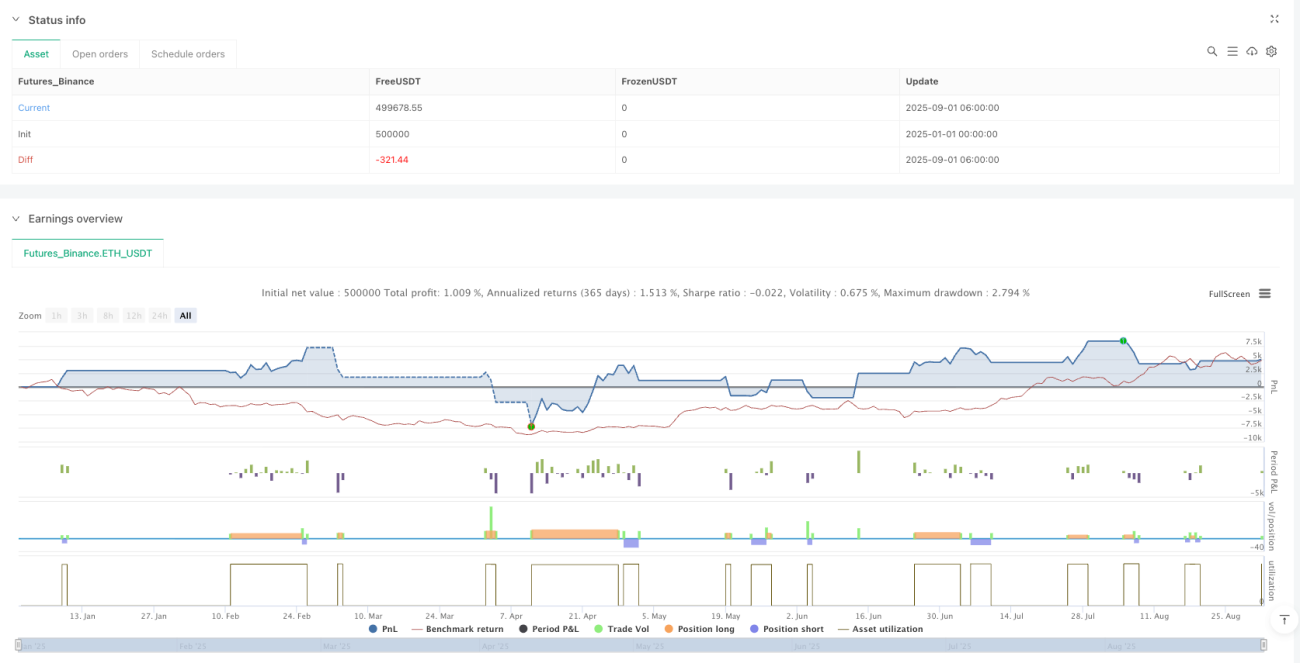
start: 2025-01-01 00:00:00
end: 2025-09-01 08:00:00
period: 2h
basePeriod: 2h
exchanges: [{"eid":"Futures_Binance","currency":"ETH_USDT","balance":500000}]
*/
//@version=5
//@fenyesk
strategy("EMA inFusion Pro - Source Selection", overlay=true, initial_capital=10000, default_qty_type=strategy.percent_of_equity, default_qty_value=10)
- 1