
1
Follow
47
Followers
Les résultats escomptés
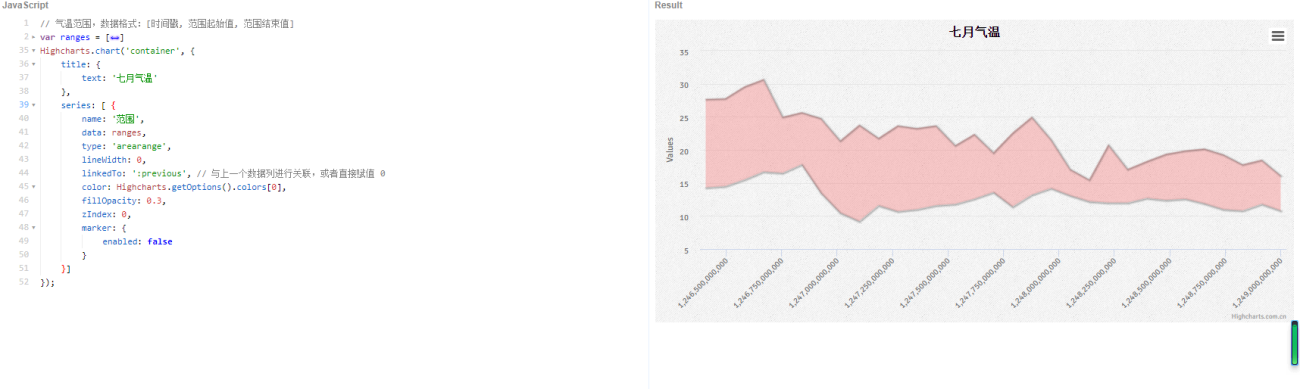
Voici le graphique que j'ai ajouté en utilisant js.
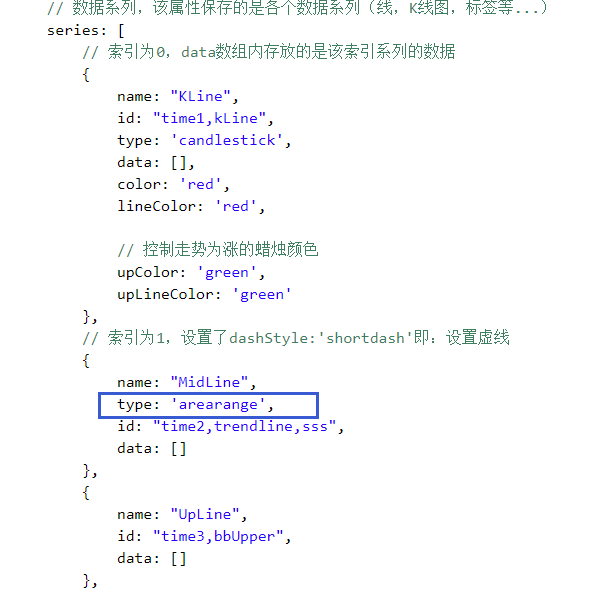
Si la stratégie type='areaerange' est annotée, le diagramme K peut être imprimé normalement, mais si la stratégie type='areaerange' est ajoutée, le diagramme K ne peut pas être affiché
La version HighChart de FMZ ne le prend pas en charge ?
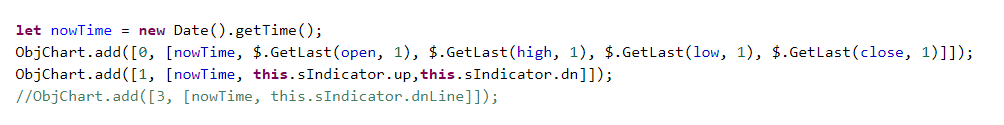
C'est ma méthode d'addition, add0 et add3 sont valides, add1 n'affiche pas de commentaire, ni aucune icône de stratégie de commentaire.
Related Recommendations
How to Specify Different Versions of Data for the Rented Strategy by Its Rental Code MetadataAdvanced Tutorial for FMZ Quant platform Strategy WritingElementary Tutorial for FMZ Quant platform Strategy WritingGet Started with FMZ Quant PlatformSECURITY BUGI keep getting error: Exchange_GetAccount: Invalid ContractTypeWe have an incredibly profitable market making algorithm for sideways markets on Bitmex - but need expert to help eliminate wait times during downward volatility in the marketError with deribitLimitations of the backtesting engineHow to install ta-lib on linux docker?
Comment
All comments (1)
- 1