Python KLineChart
Auteur:Inventeur de la quantification, Date: 2022-07-01 15h55 et 31hLes étiquettes:
Plateforme (langage JavaScript/Python) L'ouverture de KLineChart est prise en charge, la prise en charge de toutes les fonctionnalités de diagramme du langage Pine (paramètres sont cohérents), la prise en charge de signaux d'achat et de vente personnalisés Voici un exemple de démonstration
Référenceshttps://www.fmz.com/api#klinechart
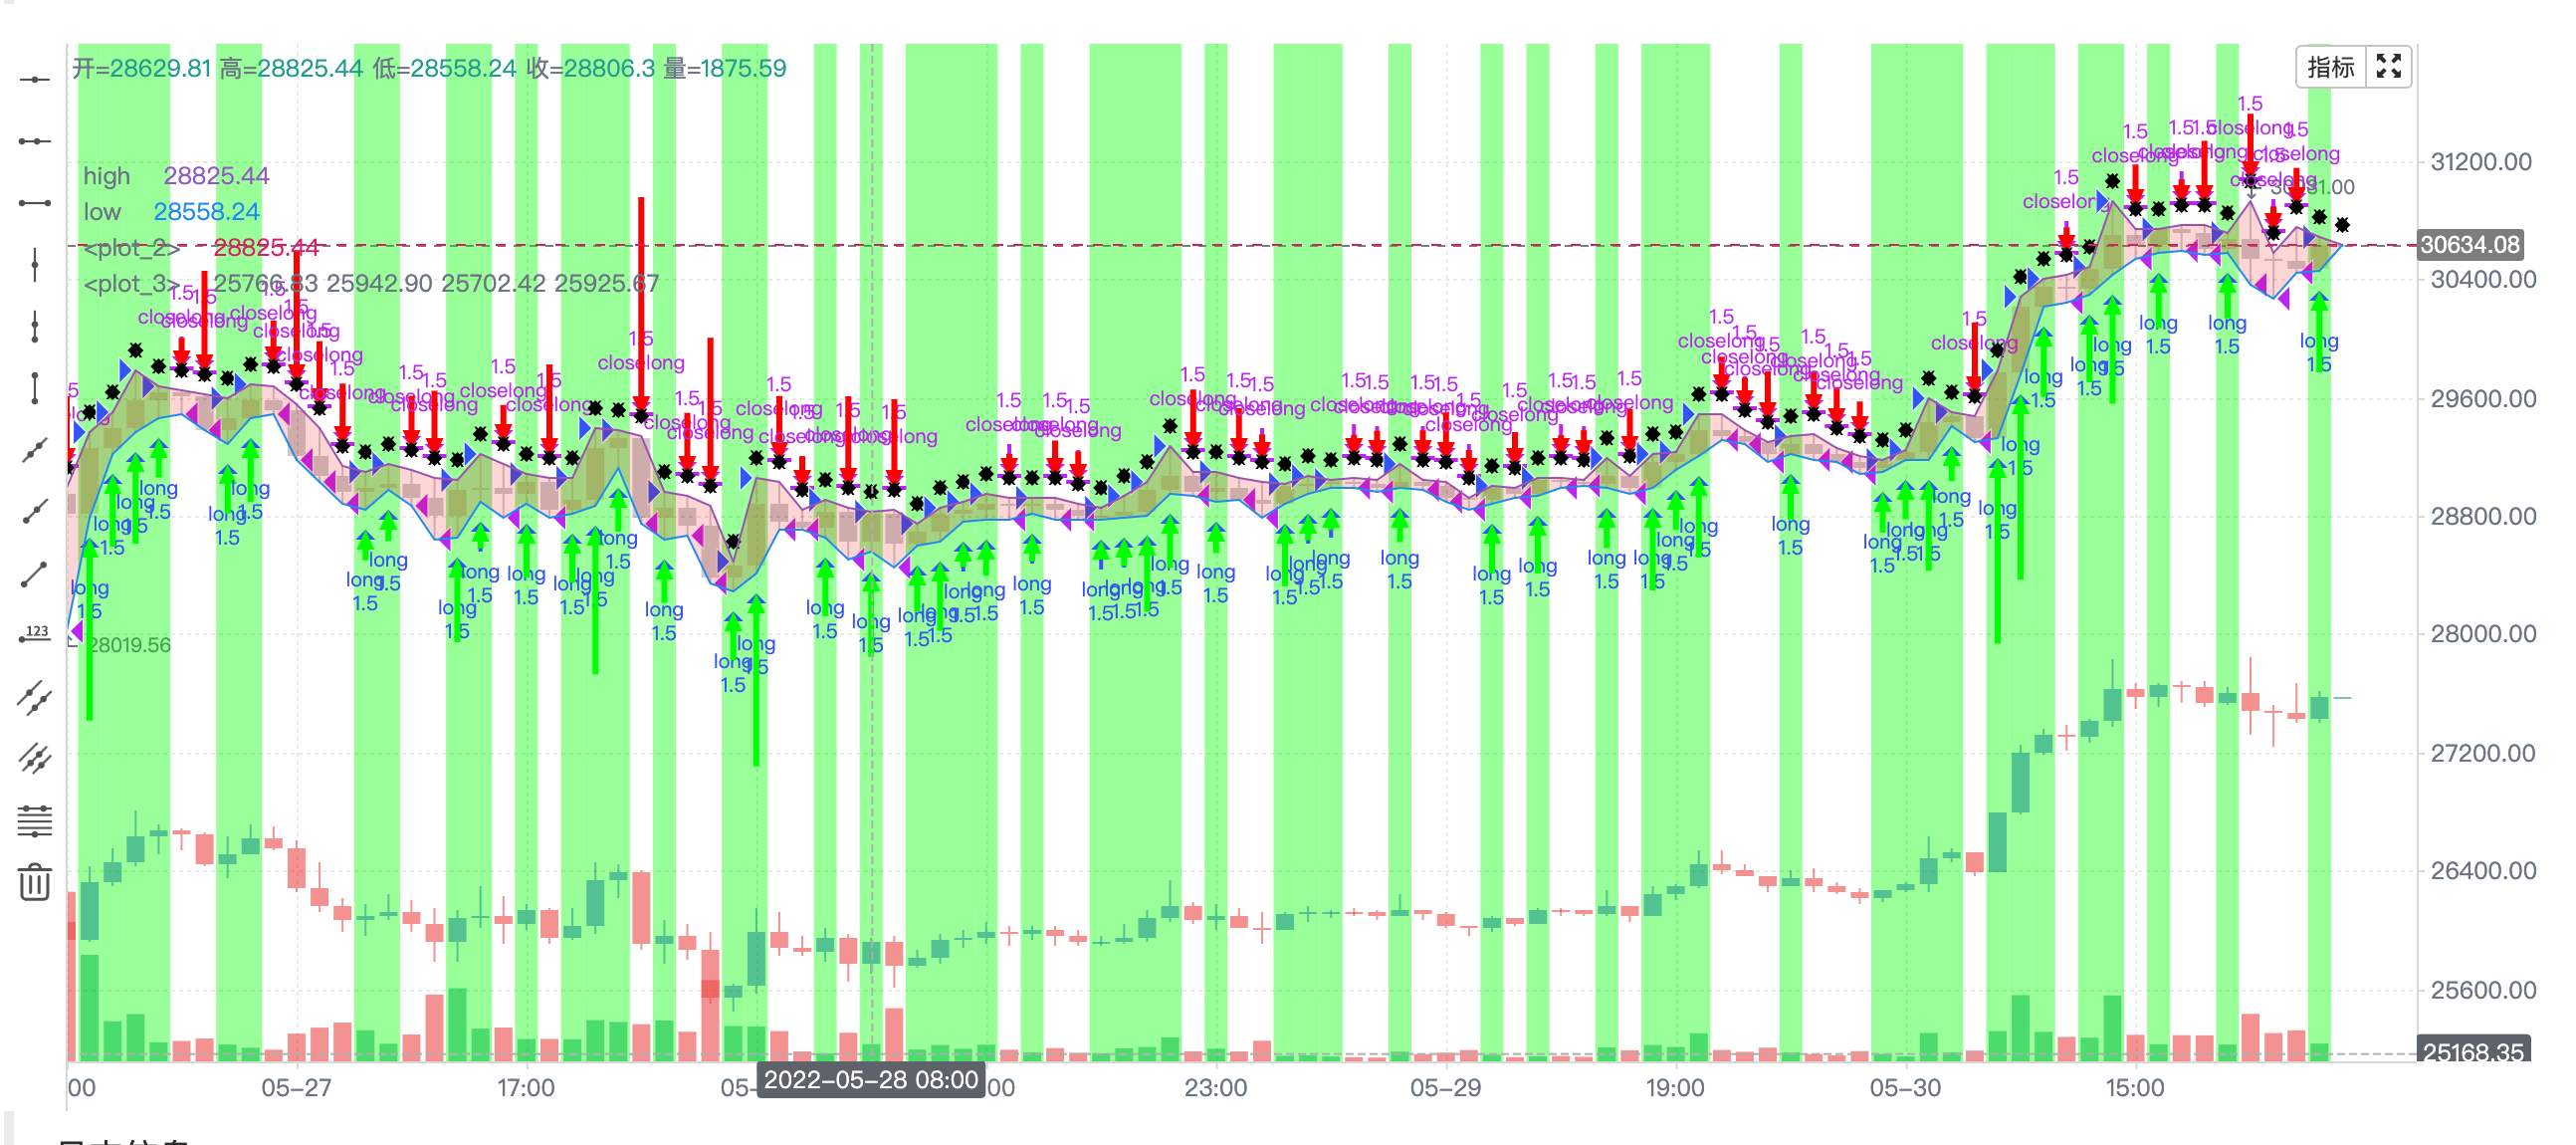
'''backtest
start: 2022-03-30 09:00:00
end: 2022-06-30 15:00:00
period: 1h
basePeriod: 15m
exchanges: [{"eid":"Binance","currency":"BTC_USDT"}]
'''


import sys
def main():
    Log(sys.version)
    c = KLineChart()
    c.reset(0)

    bars = exchange.GetRecords()
    for bar in bars:
        c.begin(bar)
        c.barcolor('rgba(255, 0, 0, 0.2)' if bar.Close > bar.Open else 'rgba(0, 0, 0, 0.2)')
        if bar.Close > bar.Open:
            c.bgcolor('rgba(0, 255, 0, 0.5)')

        h = c.plot(bar.High, 'high')
        l = c.plot(bar.Low, 'low')
        c.fill(h, l, 'rgba(255, 0, 0, 1)' if bar.Close > bar.Open else '#000000')
        c.hline(bar.High)
        c.plotarrow(bar.Close - bar.Open)
        c.plotshape(bar.Low, style = 'diamond')
        c.plotchar(bar.Close, char = 'X')
        c.plotcandle(bar.Open*0.9, bar.High*0.9, bar.Low*0.9, bar.Close*0.9)
        if bar.Close > bar.Open:
            c.signal("long", bar.High, 1.5, "LONG")
        elif bar.Close < bar.Open:
            c.signal("closelong", bar.Low, 1.5)
        c.close()
Plus de
- Des signes d'intimidation
- Goblin Town [60 min] est disponible
- Le scalper de Bitcoin [30 MIN]
- Scalpe de Vitalik
- Je vous en prie, écoutez-moi.
- Je ne sais pas si c'est vrai.
- La faim
- Big candle est partagé
- Algoritme de négociation à double poussée (ps4)
- La transaction est réglée sur la précision
- Formule finale par TraderShaman
- Des bougies HA lisses MTF v1
- LSMA à l'étape T
- Gann haut bas
- SuperTrend
- L'oscillateur de mouvement directionnel (DMI)
- RAVI F.X. Fisher
- Les stocks faciles
- Alerte de renversement Renko
- Points de renversement de la démarque [CC]