Meilleure stratégie de super-tendance
Auteur:ChaoZhang est là., Date: 2023-09-09 22:18:31 Je suis désoléLes étiquettes:
 La Supertrend Strategy est une stratégie de trading simple et efficace qui peut être utilisée pour tirer profit des marchés à tendance haussière et à tendance baissière.
L'indicateur est plus sensible aux changements de tendance et peut aider à identifier des opportunités de trading plus rentables.
La stratégie fonctionne en entrant dans les longs trades lorsque le prix dépasse la ligne de Supertrend et en sortant des longs trades lorsque le prix dépasse la ligne de Supertrend. Les trades courts sont entrés lorsque le prix dépasse la ligne de Supertrend et sortis lorsque le prix dépasse la ligne de Supertrend.
La stratégie BEST Supertrend est une stratégie simple et efficace qui peut être utilisée par les traders de tous niveaux d'expérience.
Voici quelques-uns des avantages de l'utilisation de la stratégie BEST:
Simple et facile à comprendre Efficace sur les marchés à tendance haussière et à tendance baissière Faible risque Rentable Si vous recherchez une stratégie de trading simple et efficace, la BEST Supertrend Strategy est une excellente option.
Voici quelques conseils pour utiliser la meilleure stratégie de supertrend:
Utiliser un facteur et une période élevés pour rendre l'indicateur plus sensible aux changements de tendance. Utilisez les stop-loss pour limiter les pertes. Commercer avec une petite taille pour gérer les risques. Testez la stratégie sur des données historiques pour voir comment elle fonctionne. La stratégie BEST Supertrend est une excellente façon de commencer à trader. C'est une stratégie simple et efficace qui peut être utilisée par les traders de tous niveaux d'expérience. Si vous cherchez un moyen de tirer profit des marchés, la stratégie BEST Supertrend est une excellente option.
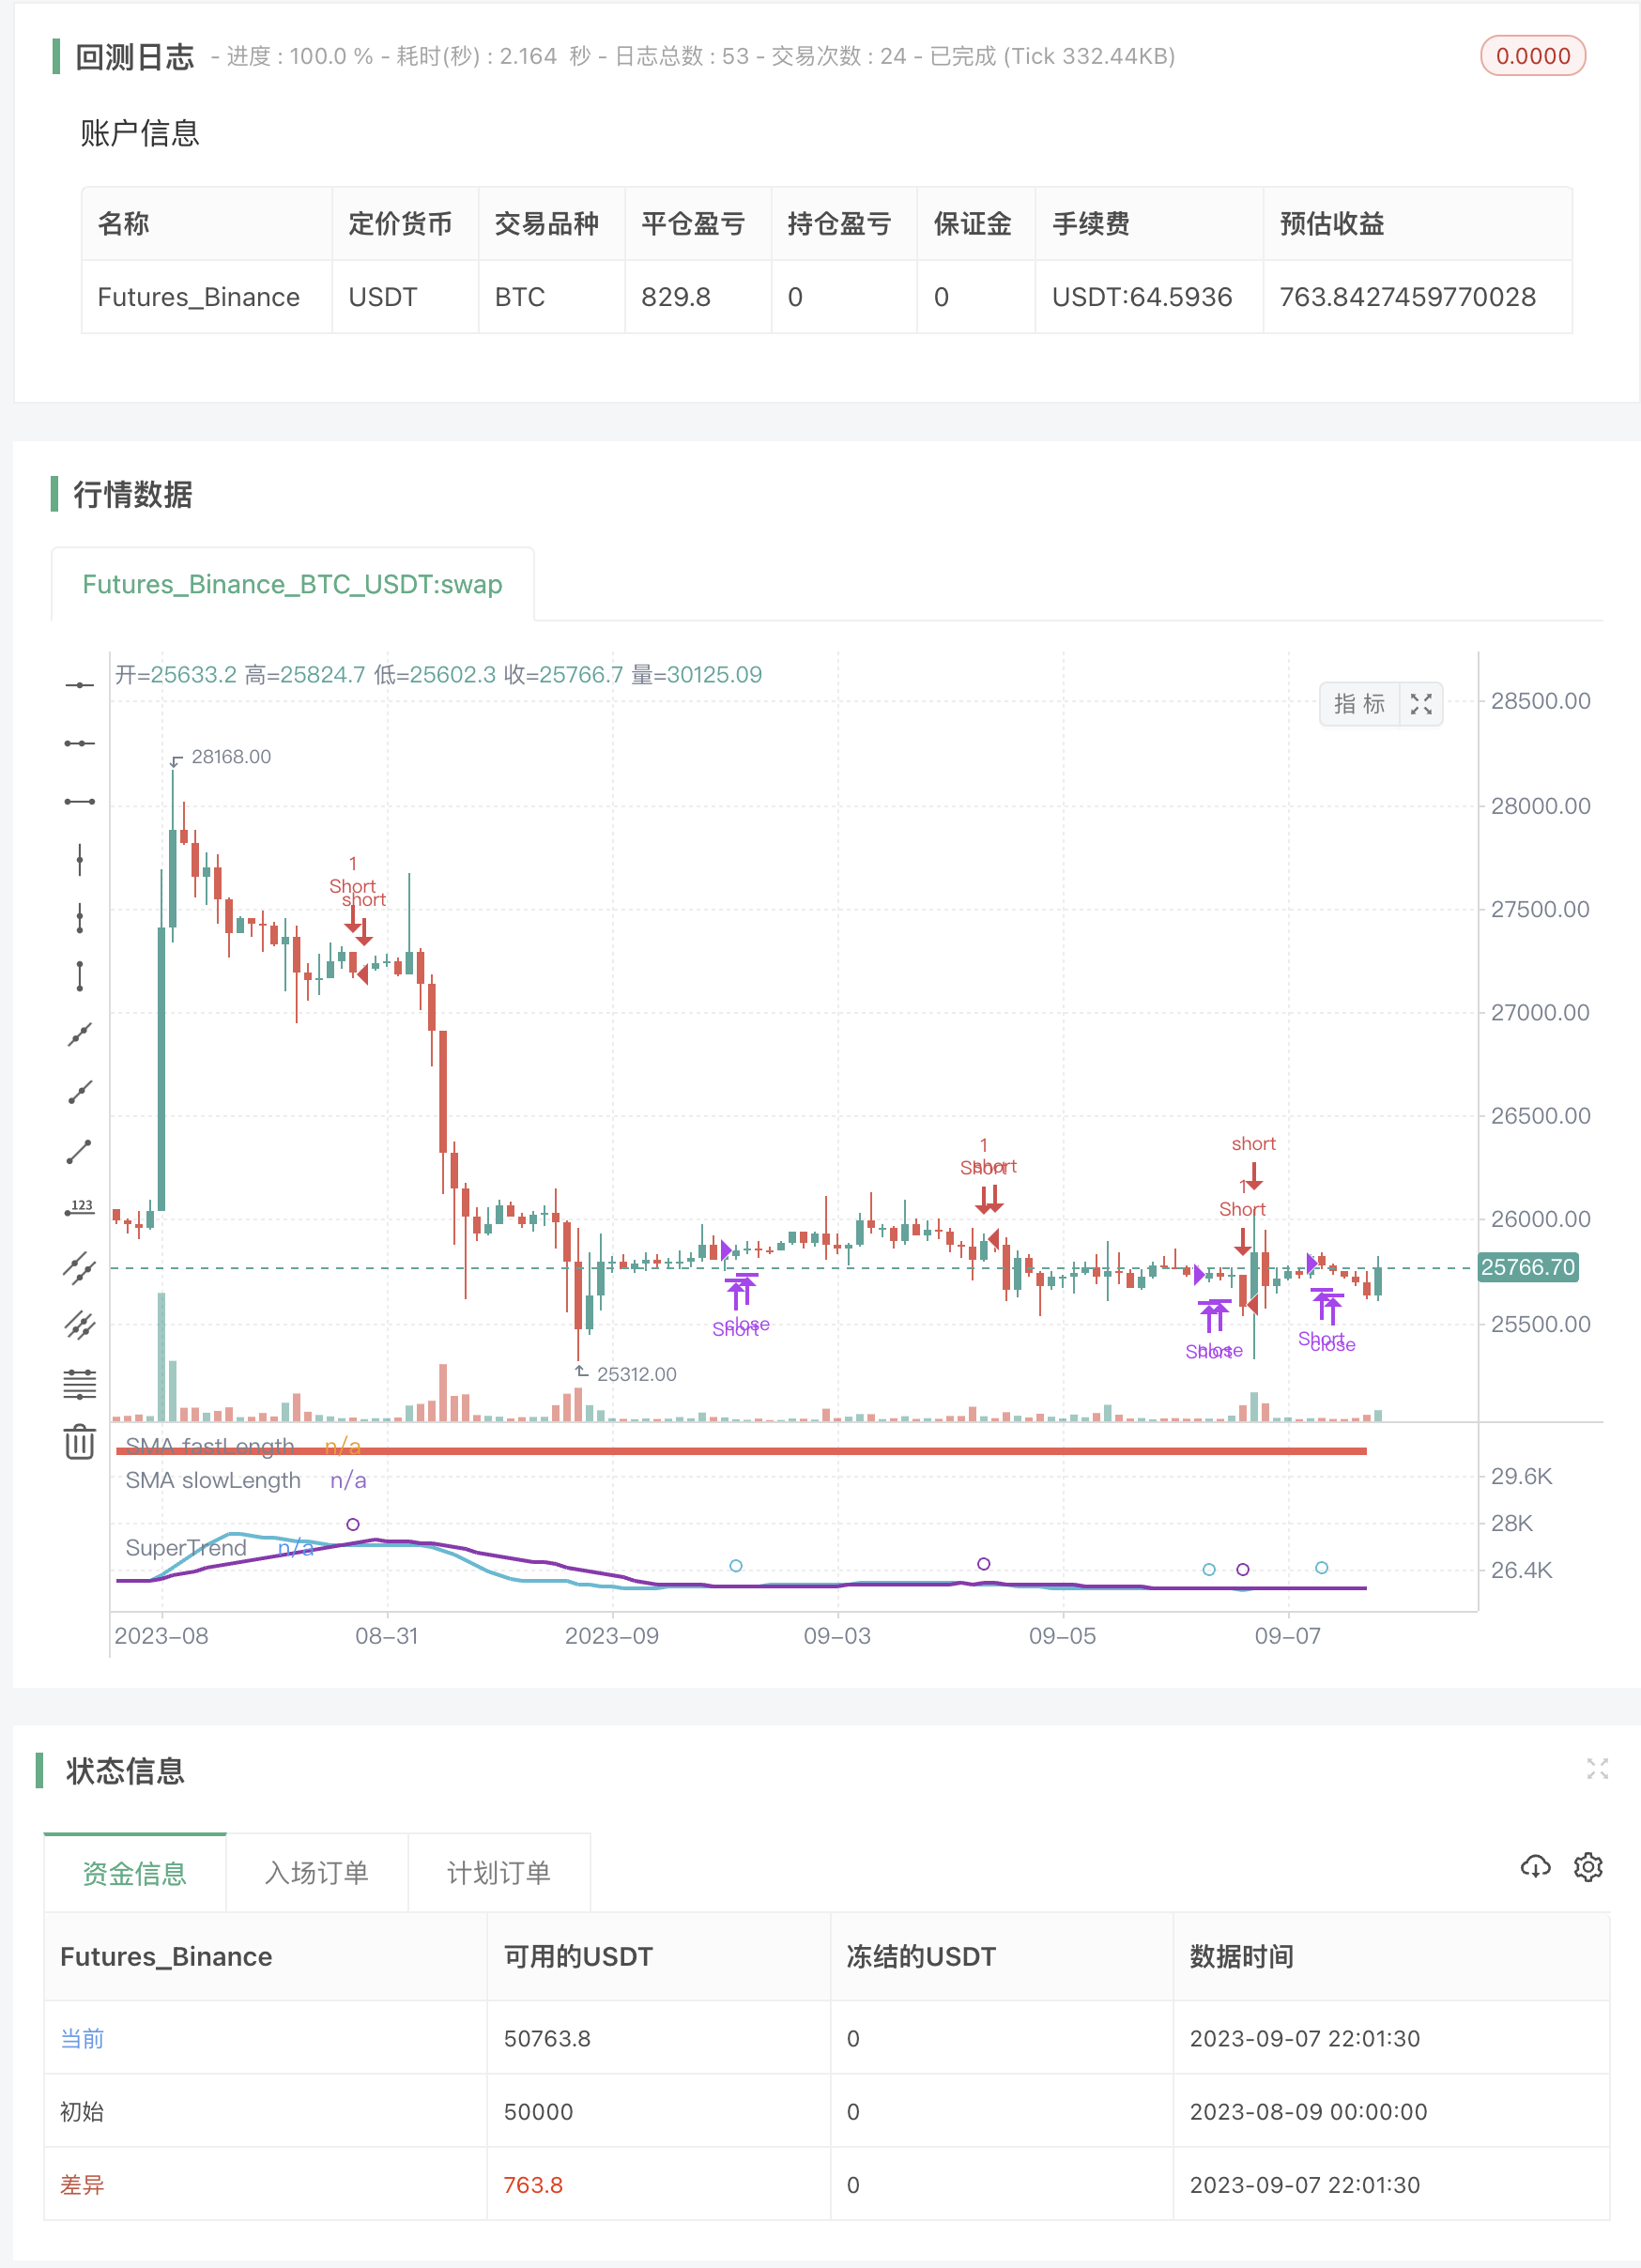
/*backtest
start: 2023-08-09 00:00:00
end: 2023-09-08 00:00:00
period: 2h
basePeriod: 15m
exchanges: [{"eid":"Futures_Binance","currency":"BTC_USDT"}]
args: [["v_input_4",2]]
*/

//@version=4
//@author=Daveatt

// strategy(title="BEST Supertrend Strategy", shorttitle="Supertrend Strategy", overlay=true,
//  pyramiding=0, default_qty_value=100, precision=7, currency=currency.USD,
//  commission_value=0.2,commission_type=strategy.commission.percent, initial_capital=1000000)


///////////////////////////////////////////////////////////////////////////////
///////////////////////////////////////////////////////////////////////////////
/////////////////////////// Strategy Component /////////////////////////////////
///////////////////////////////////////////////////////////////////////////////
///////////////////////////////////////////////////////////////////////////////

orderType = input("Longs+Shorts",title="What type of Orders", options=["Longs+Shorts","LongsOnly","ShortsOnly"])
isLong   = (orderType != "ShortsOnly")
isShort  = (orderType != "LongsOnly")

// SMA
fastLength = input(7, title="Fast Length SMA")
slowLength = input(20, title="Slow Length SMA")

///////////////////////////////////////////////////////////////////////////////
///////////////////////////////////////////////////////////////////////////////
///////////////////////////// SUPERTREND /////////////////////////////////////
///////////////////////////////////////////////////////////////////////////////
///////////////////////////////////////////////////////////////////////////////

Factor=input(3,title="[ST] Factor", minval=1,maxval = 100, type=input.float)
Pd=input(3, title="[ST] PD", minval=1,maxval = 100)
TF=input("daily", title="Supertrend timeframe", options=["daily","weekly","monthly","quartly","yearly"])

//////////////////////////
//* COLOR CONSTANTS *//
//////////////////////////

AQUA = #00FFFFFF
BLUE = #0000FFFF
RED  = #FF0000FF
LIME = #00FF00FF
GRAY = #808080FF
DARKRED   = #8B0000FF
DARKGREEN = #006400FF
GOLD = #FFD700
WHITE = color.white

// Plots
GREEN_LIGHT     = color.new(color.green, 40)
RED_LIGHT       = color.new(color.red, 40)
BLUE_LIGHT      = color.new(color.aqua, 40)
PURPLE_LIGHT    = color.new(color.purple, 40)


///////////////////////////////////////////////////////////////////////////////
///////////////////////////////////////////////////////////////////////////////
/////////////////////// SUPERTREND DETECTION //////////////////////////////////
///////////////////////////////////////////////////////////////////////////////
///////////////////////////////////////////////////////////////////////////////

f_supertrend(Factor, Pd) =>

    Up=hl2-(Factor*atr(Pd))
    Dn=hl2+(Factor*atr(Pd))

    TrendUp = 0.0
    TrendUp := close[1]>TrendUp[1] ? max(Up,TrendUp[1]) : Up
    TrendDown = 0.0
    TrendDown := close[1]<TrendDown[1]? min(Dn,TrendDown[1]) : Dn
    Trend = 0.0
    Trend := close > TrendDown[1] ? 1: close< TrendUp[1]? -1: nz(Trend[1],1)
    Tsl = Trend==1? TrendUp: TrendDown

    Tsl

st_tsl = f_supertrend(Factor, Pd)

///////////////////////////////////////////////////////////////////////////////
///////////////////////////////////////////////////////////////////////////////
////////////////////////// MULTI TIMEFRAMES CALCS /////////////////////////////
///////////////////////////////////////////////////////////////////////////////
///////////////////////////////////////////////////////////////////////////////


f_securitys(_ticker, _source)=>

    daily = security(_ticker, 'D', _source[1], lookahead=true)
    weekly = security(_ticker, 'W', _source[1], lookahead=true)
    montly = security(_ticker, 'M', _source[1], lookahead=true)
    quarterly = security(_ticker, '3M', _source[1], lookahead=true)
    yearly = security(_ticker, '12M', _source[1], lookahead=true)

    [daily, weekly, montly, quarterly, yearly]


[st_daily, st_weekly, st_monthly, st_quarterly, st_yearly] = f_securitys(syminfo.tickerid, st_tsl)

lapos_x = timenow + round(change(time)*50)
lapos_y = close

down_arrows_text = "▼" + " " + "▼" + " " + "▼" + " " + "▼" + " " + "▼" + " " + "▼" + " " + "▼" + "\n"

// Drawing function designed by RicardoSantos.
f_draw_infopanel(_x, _y, _color, _line, _text)=>
    _rep_text = ""
    for _l = 0 to _line
        _rep_text := _rep_text + "\n"
    _rep_text := _rep_text + _text

    var label _la = na
    label.delete(_la)
    _la := label.new(x=_x, y=_y, text=_rep_text, xloc=xloc.bar_time, yloc=yloc.price,
     color=#C1CADE,  textcolor=_color, size=size.normal)

// Using the JustUncleL reverse order trick
f_draw_infopanel(lapos_x, lapos_y, color.olive,                 12, "╚═══════════════════════╝")
f_draw_infopanel(lapos_x, lapos_y, color.new(color.red, 20),    10,  "Yearly : " + tostring(round(st_yearly)))
f_draw_infopanel(lapos_x, lapos_y, color.new(color.purple, 20), 8,  "Quarterly : " + tostring(round(st_quarterly)))
f_draw_infopanel(lapos_x, lapos_y, color.new(color.green, 20),  6,  "Monthly : " + tostring(round(st_monthly)))
f_draw_infopanel(lapos_x, lapos_y, color.new(color.blue, 20),   4,  "Weekly : " +  tostring(round(st_weekly)))
f_draw_infopanel(lapos_x, lapos_y, color.new(color.green, 20),  2,  "Daily : " +  tostring(round(st_daily)))
f_draw_infopanel(lapos_x, lapos_y, color.olive,                 0,  "╔═════ Supertrend (" + tostring(Factor) + "," + tostring(Pd) + ") ═════╗")

IS_DAILY = TF == "daily"
IS_WEEKLY = TF == "weekly"
IS_MONTHLY = TF == "monthly"
IS_QUARTERLY = TF == "quarterly"
IS_YEARLY = TF == "yearly"

// select right supertrend
st_tsl_TF = iff(IS_DAILY, st_daily,
 iff(IS_WEEKLY, st_weekly,
 iff(IS_MONTHLY, st_monthly,
 iff(IS_QUARTERLY, st_quarterly,
 iff(IS_YEARLY, st_yearly, st_daily)))))


// hard exit
sma_fast = sma(close, fastLength)
sma_slow = sma(close, slowLength)
long_exit     = crossunder(sma_fast,sma_slow)
short_exit    = crossover(sma_fast,sma_slow)

// MA Cross
curr = 0 - barssince(long_exit) + barssince(short_exit)
cross_buy = curr < 0 ?  1 : 0
cross_sell = curr > 0 ? 1  : 0

bull = close >= st_tsl_TF and cross_buy
bear = close <= st_tsl_TF and cross_sell
entry_price = valuewhen(bull or bear, close, 0)

plot(sma_fast, "SMA fastLength", color=color.aqua, linewidth=2)
plot(sma_slow, "SMA slowLength", color=color.purple, linewidth=2)
plotshape(crossover(sma_fast,sma_slow), color=color.aqua, style=shape.circle, size=size.small)
plotshape(crossunder(sma_fast,sma_slow), color=color.purple, style=shape.circle, size=size.small)

// Plot the ST
linecolor = close >= st_tsl_TF ? color.green : color.red
plot(st_tsl_TF, color = linecolor , linewidth = 4,title = "SuperTrend", transp=0)

// Strategy entries/exits
if isLong
    strategy.entry("Long", 1, when=bull)
    strategy.close("Long", when=long_exit)

if isShort
    strategy.entry("Short", 0,  when=bear)
    strategy.close("Short", when=short_exit )
- Stratégie de système de négociation à tendance haussière et survente d'indices
- Stratégie de négociation de tendance quantitative utilisant la régression polynomielle
- Combo Backtest 123 Inversion et indice de volatilité relative
- La stratégie de négociation SMA-3
- La stratégie de négociation automatisée de la bande de Bollinger
- La stratégie de négociation croisée Genesis
- La stratégie des bandes de pistolets
- Stratégie de négociation par paire
- La stratégie de portée ouverte avec objectif de profit dynamique
- Appuyez sur la stratégie d'inversion
- Système d'inversion
- Stratégie EMA adaptative à retard zéro
- Le nuage ICHIMOKU de BV - Tous les signaux
- Stratégie de l'indice de force relative
- Les bandes de Bollinger + EMA 9
- La stratégie EMA20 simple + le stochastique
- NTPC client UDP et Exchange Server retard
- VWMA + SMA Bollinger Bands + RSI Strategy: analyse de la corrélation entre le prix et le volume
- L'EMA200 et la stratégie RSI stochastique
- Résistance de support de la ligne Trade05-K + arrêt ATR