
Aperçu
La stratégie est un système de négociation basé sur l'analyse de la morphologie des bandes de Brin et des rayons pour capturer les opportunités de retournement de marché en analysant les fluctuations des prix et les caractéristiques des rayons au niveau de la ligne solaire. Le cœur de la stratégie est la combinaison des canaux de volatilité des bandes de Brin et des relations de taux entre les lignes d'ombre et les entités sur le graphique, à la recherche de signaux de retournement potentiels lorsque les prix touchent les limites des bandes de Brin. Le système prend en charge l'analyse à cycles multiples et est capable de négocier sur des périodes de temps plus courtes tout en conservant l'analyse au niveau de la ligne solaire.
Principe de stratégie
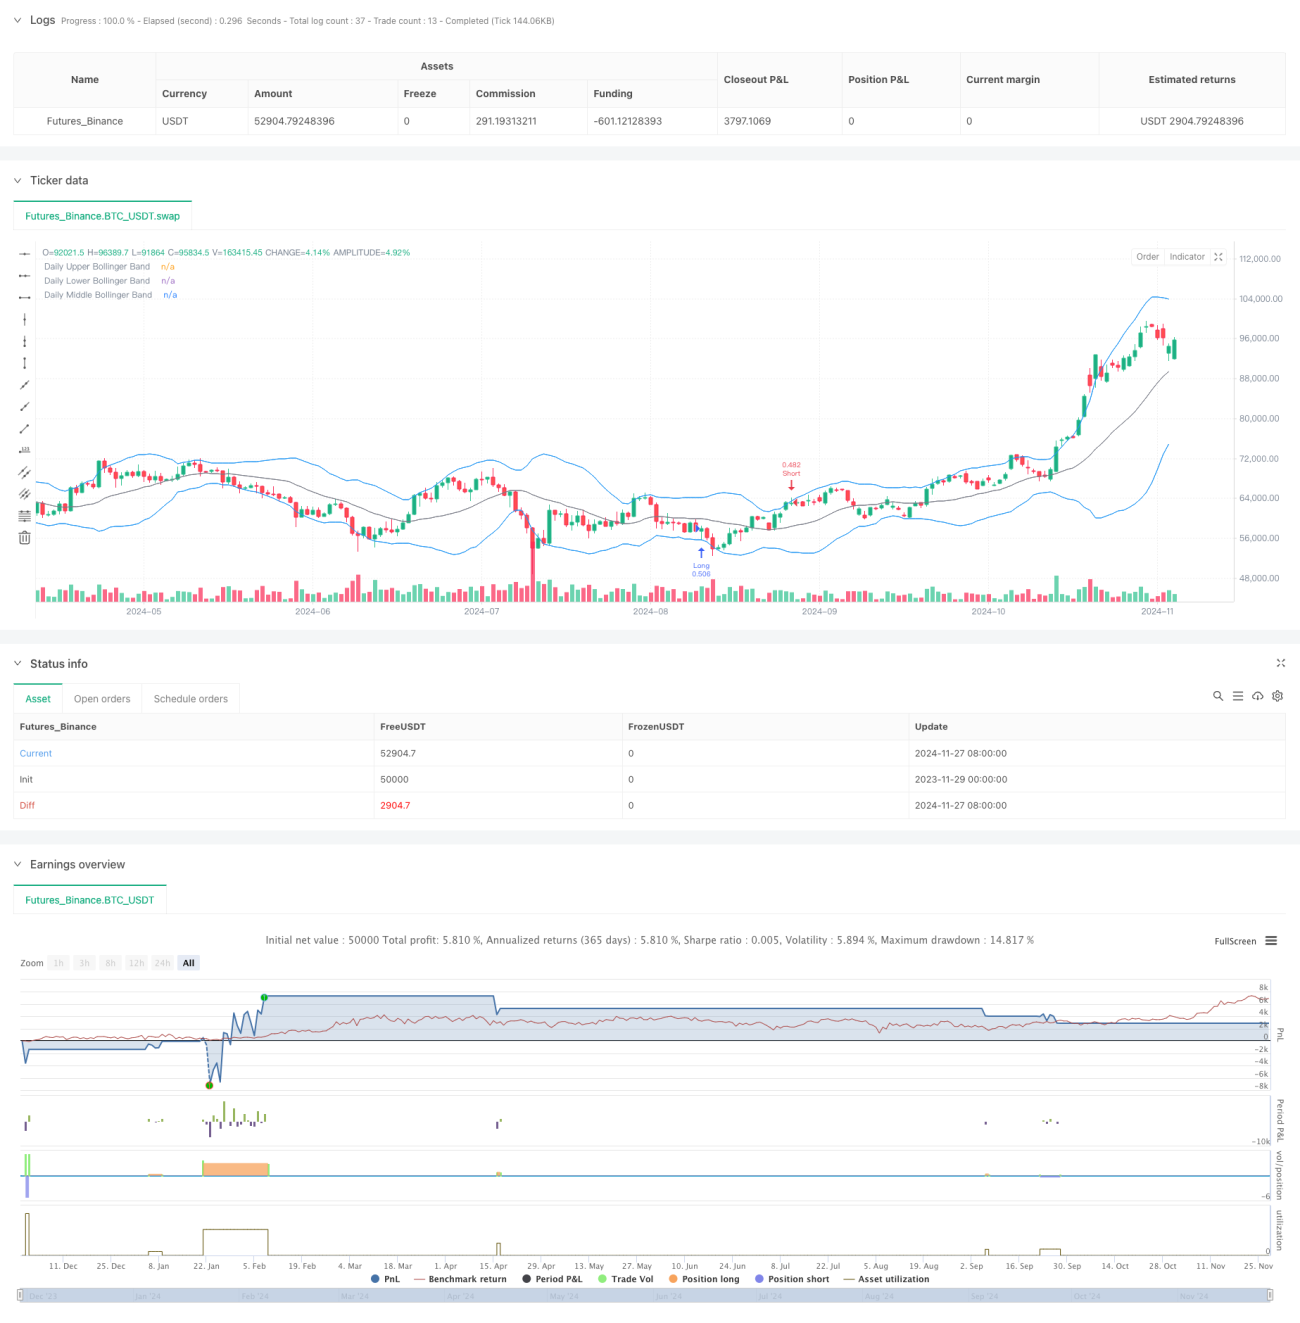
La stratégie utilise une bande de bourlingue de 20 cycles comme indicateur technique principal, avec un facteur de différence standard de 2,0. Le système émet un signal de transaction en calculant le rapport entre le haut et le bas de la courbe et l'entité, lorsque ce rapport dépasse le seuil de réglage (par défaut 1,0) et que le prix touche la frontière de la bande de bourlingue. Le timing d'entrée offre la possibilité de choisir avec souplesse le cours de récolte du jour, le prix d'ouverture du lendemain, le sommet ou le bas de la journée.
Avantages stratégiques
- L'analyse multidimensionnelle, combinée à l'analyse des indicateurs techniques et des tendances des prix, améliore la fiabilité du signal.
- Mécanisme d'entrée flexible: offre une large gamme d'options d'entrée adaptées aux différents styles de négociation.
- Une bonne gestion des risques: contrôler les risques grâce à une portée dynamique des positions et à un arrêt automatique des pertes.
- Compatibilité multi-périodes: les transactions peuvent être exécutées sur des périodes plus courtes tout en conservant l'analyse de la ligne du jour.
- Autonomie élevée: l'automatisation est réalisée de la reconnaissance des signaux à la gestion des positions.
Risque stratégique
- Risque de fluctuation du marché: il peut y avoir de faux signaux dans un marché très volatile.
- Risque de retard: l'utilisation de données de ligne solaire peut entraîner une réaction insuffisante dans les marchés rapides.
- Sensitivité des paramètres: le choix des paramètres de la bande de Brin et des valeurs de seuil du ratio de ligne d'ombre peut avoir un impact significatif sur la performance de la stratégie.
- Risques liés à la liquidité: dans les marchés moins liquides, il peut être difficile de négocier au prix attendu.
Orientation de l'optimisation de la stratégie
- Introduction de l'analyse de la quantité d'échange: la combinaison de données de la quantité d'échange pour vérifier l'efficacité du renversement des prix.
- Augmenter le filtrage des conditions de marché: ajouter des indicateurs de force de tendance pour filtrer les conditions défavorables du marché.
- Les paramètres d'optimisation s'adaptent à eux-mêmes: les paramètres de la bande de Bryn et le seuil du ratio de ligne d'ombre sont ajustés en fonction de la dynamique des fluctuations du marché.
- Améliorer les contrôles des risques: augmenter les contrôles de rétractation et les mécanismes de surveillance de la courbe des intérêts.
- Confirmation du signal renforcé: introduction d'autres indicateurs techniques comme outils de confirmation auxiliaires.
Résumer
Il s'agit d'un système de trading complet qui combine l'analyse des bandes de Brin et des diagrammes pour capturer les opportunités de retournement du marché grâce à une analyse multidimensionnelle. L'avantage de la stratégie réside dans son cadre d'analyse complet et son système de gestion des risques parfait, mais il faut également tenir compte de l'impact de l'environnement du marché et du choix des paramètres sur la performance de la stratégie.
/*backtest
start: 2023-11-29 00:00:00
end: 2024-11-28 00:00:00
period: 1d
basePeriod: 1d
exchanges: [{"eid":"Futures_Binance","currency":"BTC_USDT"}]
*/

//@version=5
strategy("Trade Entry Detector, based on Wick to Body Ratio when price tests Bollinger Bands", overlay=true, default_qty_type=strategy.fixed)

// Input for primary analysis time frame- 1