
Aperçu
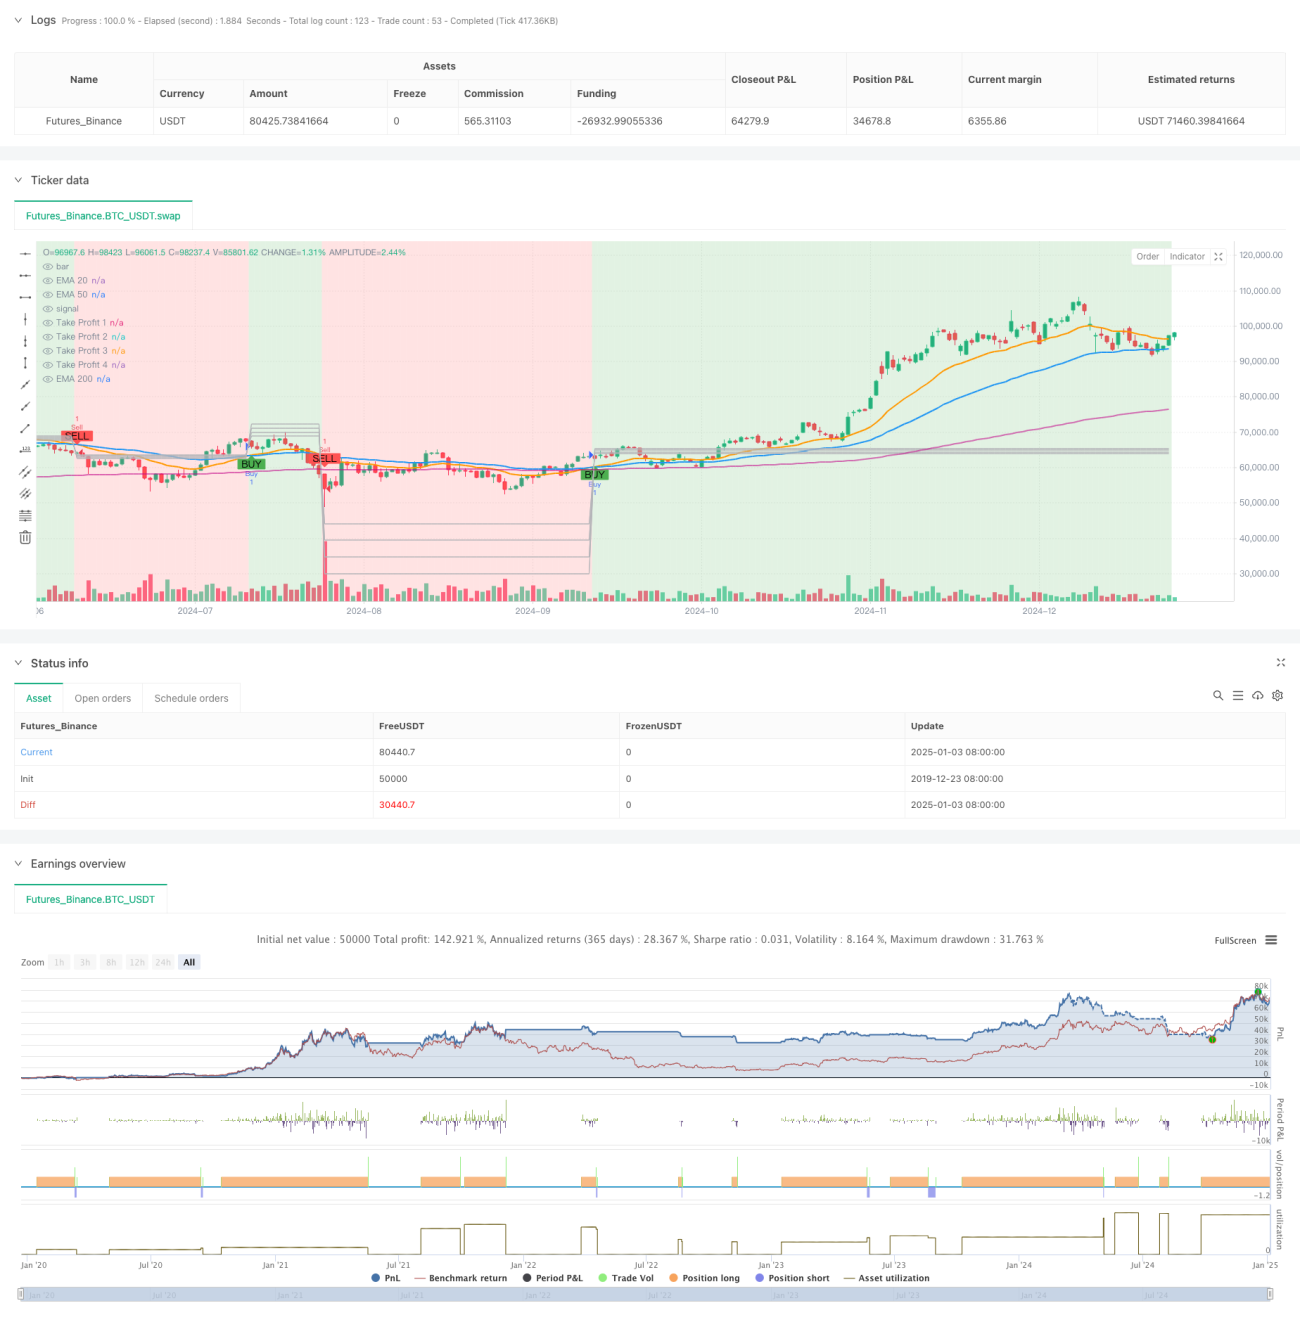
Cette stratégie est un système de trading basé sur les moyennes mobiles exponentielles (EMA), qui utilise principalement le croisement des EMA20 et EMA50 pour identifier les changements de tendance du marché. La stratégie conçoit des points de prise de bénéfices multi-niveaux dynamiques, associés à un mécanisme de stop-loss pour contrôler les risques. Le système affiche visuellement la direction de la tendance du marché grâce à des changements de couleur d'arrière-plan, aidant ainsi les traders à mieux appréhender l'évolution du marché.
Principe de la stratégie
La logique centrale de la stratégie repose sur les aspects suivants :
- Utiliser le croisement des EMA20 et EMA50 pour déterminer la direction de la tendance : lorsque l'EMA20 croise au-dessus de l'EMA50, un signal d'achat est généré ; lorsqu'elle croise en dessous, un signal de vente est émis.
- Définir dynamiquement quatre objectifs de prise de bénéfices en fonction de l'amplitude des fluctuations de la bougie précédente :
- TP1 fixé à 0,5 fois l'amplitude des fluctuations
- TP2 fixé à 1,0 fois l'amplitude des fluctuations
- TP3 fixé à 1,5 fois l'amplitude des fluctuations
- TP4 fixé à 2,0 fois l'amplitude des fluctuations
- Mettre en place un stop-loss à 3 % pour contrôler les risques.
- Afficher la direction de la tendance par un changement de couleur d'arrière-plan des bougies : vert pour une tendance haussière, rouge pour une tendance baissière.
Avantages de la stratégie
- Points de prise de bénéfices dynamiques : les objectifs de profit s'ajustent automatiquement en fonction de la volatilité réelle du marché, offrant une grande adaptabilité.
- Mécanisme multi-niveaux de prise de bénéfices : en définissant plusieurs points, on sécurise les gains tout en laissant suffisamment d'espace pour le développement de la tendance.
- Effet visuel marqué : la direction de la tendance est clairement indiquée par la couleur d'arrière-plan, ce qui permet d'évaluer rapidement l'état du marché.
- Contrôle des risques complet : un stop-loss fixe est défini, limitant efficacement la perte maximale par transaction.
- Paramètres flexibles et ajustables : le trader peut modifier les multiplicateurs des points de prise de bénéfices et le pourcentage de stop-loss en fonction des conditions du marché.
Risques de la stratégie
- Retard des moyennes mobiles : les EMA présentent un retard inhérent, ce qui peut entraîner des signaux tardifs.
- Risque en marché range : dans un marché latéral, des signaux fréquents et faux peuvent se produire.
- Stop-loss fixe : un stop-loss à pourcentage fixe peut ne pas être adapté à tous les environnements de marché.
- Écart entre les points de prise de bénéfices : sur des marchés très volatils, l'écart entre les points peut être trop grand ou trop petit.
Pistes d'optimisation de la stratégie
- Introduire des indicateurs auxiliaires : ajouter des indicateurs comme le RSI ou le MACD pour confirmer les signaux de croisement.
- Optimiser le mécanisme de stop-loss : envisager d'utiliser l'ATR pour définir dynamiquement la distance du stop-loss.
- Ajouter un filtre temporel : inclure une fenêtre de trading pour éviter les périodes de forte volatilité.
- Améliorer la gestion de la taille des positions : ajuster dynamiquement la taille des positions en fonction de la volatilité du marché.
- Renforcer la confirmation des signaux : utiliser des indicateurs de volume comme condition de confirmation supplémentaire.
Résumé
Il s'agit d'une stratégie de suivi de tendance complète et logiquement claire. Elle capture les tendances via les croisements de moyennes mobiles, gère les bénéfices avec des points de prise de bénéfices dynamiques, et contrôle les risques avec un stop-loss. Sa conception visuelle est intuitive et efficace, et ses paramètres sont flexibles et ajustables. Bien qu'elle souffre du problème de retard inhérent aux moyennes mobiles, des optimisations et améliorations peuvent renforcer sa stabilité et sa rentabilité.
- 1