Stratégie de trading de divergence et de suivi de tendance de l'indicateur Donchian multi-période

Aperçu
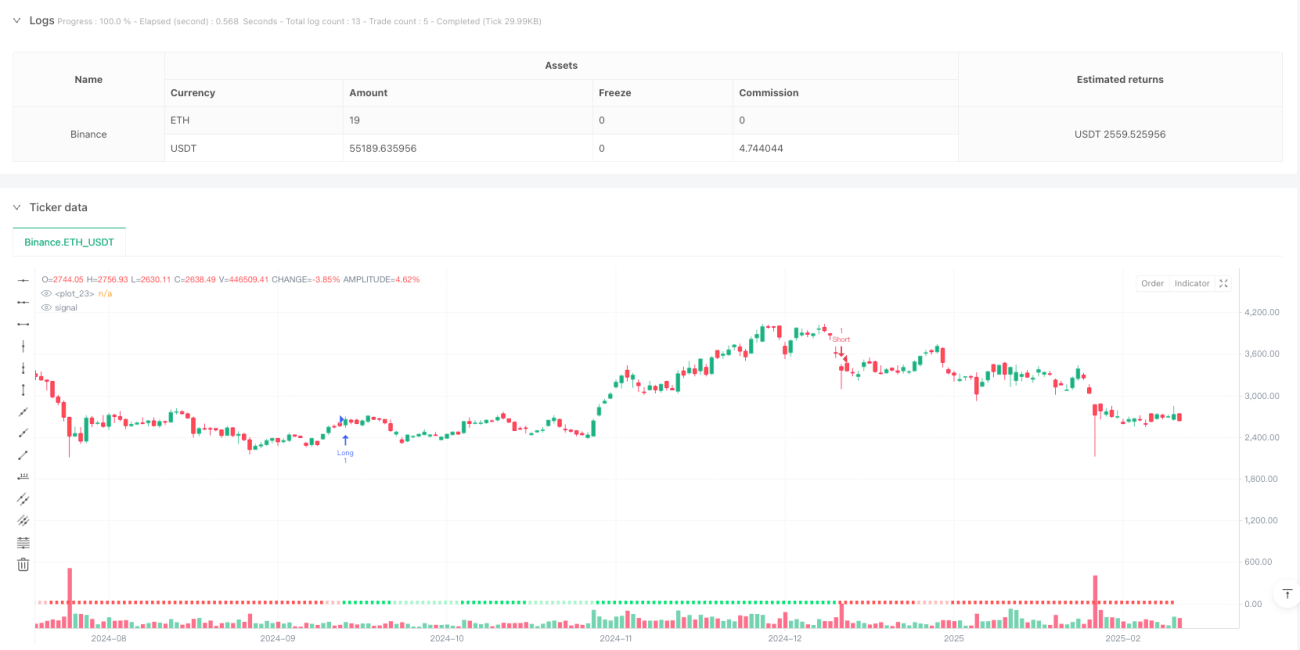
La stratégie est basée sur des indicateurs de la voie de Dongguan sur plusieurs périodes pour construire un système de suivi des tendances. En analysant les ruptures de la voie de Dongguan sur différentes périodes de temps, la combinaison des tendances principales et des tendances locales forme un graphique de bande de tendance visuellement intuitif. La stratégie utilise des changements de couleurs profondes pour montrer la force et la faiblesse de la tendance, les bandes vertes représentant une tendance à la hausse et les bandes rouges une tendance à la baisse.
Principe de stratégie
Le cœur de la stratégie est de déterminer la tendance en fonction de l'indicateur du canal de Donchian. Le canal de Donchian est composé de canaux de prix les plus élevés et les canaux de prix les plus bas, qui déterminent la tendance en comparant les prix actuels avec la relation de position du canal. Il comprend principalement les éléments clés suivants:
- Détermination de la tendance principale: utilisation de la voie de Dongguan à 20 cycles, lorsque les prix franchissent la trajectoire ascendante pour former une tendance à la hausse, la rupture de la trajectoire descendante pour former une tendance à la baisse
- Détermination de la tendance locale: dans le cadre de la tendance principale, la courbe de la voie de Tangjian à plus courte période est utilisée pour déterminer la direction de la tendance locale
- Bande de tendance: une bande de tendance est formée par la combinaison de 10 cycles différents de la chaîne de Dongxian, les couleurs sombres et claires reflètent l'intensité de la tendance
- Signaux de négociation: tendance principale à la hausse, ouverture d'une offre en surplus, tendance principale à la baisse, ouverture d'une offre vide, inversion de tendance, plafonnement
Avantages stratégiques
- Jugez les tendances objectivement: jugez les tendances sur la base de la rupture des prix, en évitant les biais causés par les jugements subjectifs
- Confirmation de plusieurs cycles: accroître la précision des jugements de tendances en superposant les tendances de différents cycles
- Les effets visuels sont intuitifs: les changements de couleur de la bande de tendance sont visuels pour afficher l'état du marché.
- Les règles de négociation sont claires: les signaux d'entrée et de sortie sont clairs et faciles à mettre en œuvre
- Adaptabilité: les paramètres peuvent être ajustés en fonction des caractéristiques de la variété de transaction pour optimiser la performance de la stratégie
Risque stratégique
- Risque de renversement de la tendance: un retrait plus important peut se produire à un tournant de la tendance
- Les marchés de choc ne s'appliquent pas: les mouvements transversaux peuvent générer de faux signaux.
- Sensitivité des paramètres: les paramètres peuvent avoir une incidence significative sur l'efficacité de la stratégie
- Effets des points de glissement: les transactions fréquentes peuvent être affectées par les points de glissement
- Risque systémique: les événements inattendus sur le marché peuvent entraîner des pertes importantes
Orientation de l'optimisation de la stratégie
- Augmentation du filtrage de la force de la tendance: introduire des indicateurs de force de tendance tels que l'ADX, filtrer les signaux de tendance faible
- Optimisation des paramètres d'arrêt: réglage dynamique de la position d'arrêt basé sur l'ATR pour améliorer la capacité de contrôle des risques
- Ajout de confirmation de transaction: analyse de transaction combinée pour vérifier l'efficacité de la tendance
- Introduction d'une adaptation à la volatilité: paramètres d'ajustement dynamique en fonction de la volatilité du marché
- Amélioration de la gestion des positions: ajustement dynamique des positions en fonction de la force de la tendance
Résumer
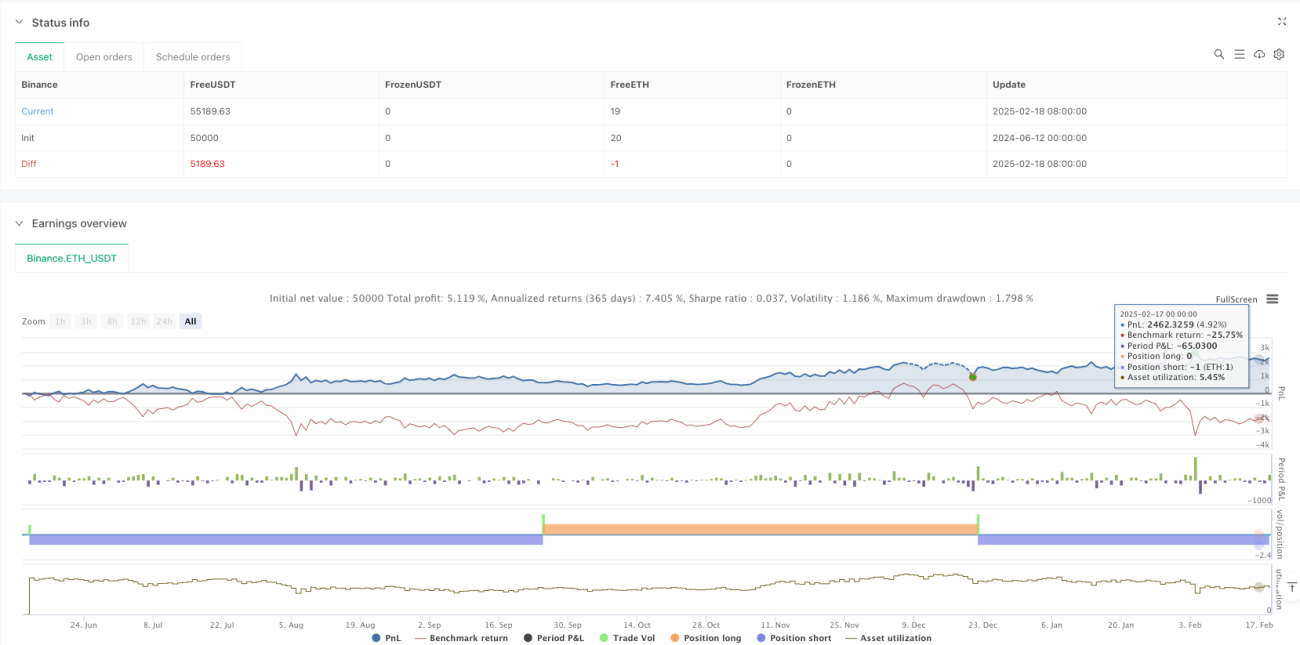
La stratégie utilise une application innovante du canal de Dongxian à cycles multiples pour construire un système de trading de suivi de tendance avec des effets visuels et une logique claire. Son avantage central réside dans la visualisation du processus complexe d'analyse de tendance, ce qui permet aux traders de saisir intuitivement les mouvements du marché.
/*backtest
start: 2024-06-12 00:00:00
end: 2025-02-19 08:00:00
period: 1d
basePeriod: 1d
exchanges: [{"eid":"Binance","currency":"ETH_USDT"}]
*/

//@version=6
strategy("Donchian Trend Ribbon Strategy", shorttitle="DonchianTrendRibbonStrat", overlay=true, precision=0)

//~~~~~~~~~~~~~~~~~~~~~~~~~~~~~~~~~~~~~~~~~~~~~~~~~~~~~~~~~~~~~~~~~~~~~~~~~~~~~~- 1