
Aperçu
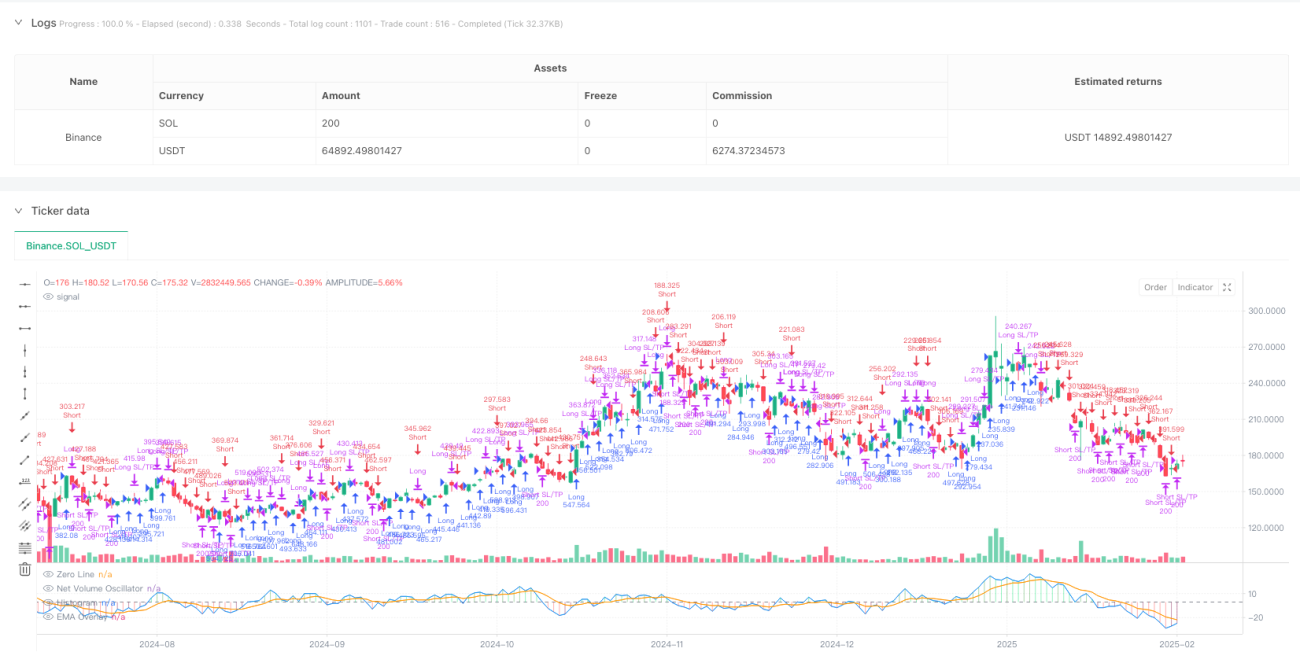
La stratégie est un système de suivi des tendances basé sur le volume des transactions et les variations de prix, qui permet de prédire l'orientation du marché en calculant l'indicateur de volatilité du volume des transactions netes (NVO). La stratégie combine plusieurs types de moyennes mobiles (EMA, WMA, SMA, HMA) pour juger de la tendance du marché en comparant la relation de position de l'indicateur de volatilité avec sa ligne de superposition EMA, et pour effectuer des transactions au moment opportun.
Principe de stratégie
Le cœur de la stratégie est de juger de l'humeur du marché en calculant les fluctuations quotidiennes du volume net de transactions. Les étapes de calcul sont les suivantes:
- Calculer le multiplicateur de la fourchette de prix: un multiplicateur entre 0 et 1 basé sur le prix le plus élevé, le prix le plus bas et le prix de clôture du jour
- Calcul du volume de transactions qui a effectivement augmenté ou diminué: pondération du volume de transactions en fonction de la direction de la variation des prix et multiplication par
- Calculer le volume de transactions net: le volume de transactions effectivement augmenté moins le volume de transactions effectivement diminué
- Moyenne mobile sélectionnée par l'application: traitement en douceur des données de transaction nette
- Calculer la ligne de superposition EMA: une ligne de référence pour juger de la tendance
- Calculer le taux de variation (ROC): utilisé pour déterminer la variation de la force de la tendance
La génération du signal de transaction est basée sur les règles suivantes:
- Les conditions sont multiples: les indicateurs de secousse sont surmontés de lignes EMA
- Conditions de mise à l'air: traverser la ligne de superposition EMA sous l'indicateur de secousse
- Stop loss: Stop loss basé sur le pourcentage
- Stop-loss: Stop-loss basé sur le pourcentage
Avantages stratégiques
- Analyse multidimensionnelle: information sur le marché combinant les trois dimensions du prix, du volume et du taux de variation des tendances
- Haute flexibilité: support de plusieurs types de moyennes mobiles, qui peuvent être ajustées en fonction de différentes caractéristiques du marché
- Gestion des risques: un mécanisme d'arrêt des pertes pour contrôler efficacement les risques
- Des visualisations puissantes: les variations d'intensité de la tendance sont affichées sur des diagrammes rectangulaires pour faciliter la compréhension de l'état du marché
- Adaptabilité: grâce à une conception paramétrable, il est possible de s'adapter à différents environnements de marché et variétés de transactions
Risque stratégique
- Risque de renversement de tendance: Faux signaux fréquents dans un marché en crise
- Risque de retard: les moyennes mobiles sont elles-mêmes retardées, ce qui peut entraîner des temps d'entrée et de sortie inadéquats.
- Sensibilité des paramètres : différentes combinaisons de paramètres peuvent entraîner de grandes différences dans les performances de la stratégie
- Dépendance aux environnements de marché: risque de sous-performance dans certains environnements
- Limitations techniques: se baser uniquement sur des indicateurs techniques et ne pas tenir compte des facteurs fondamentaux
Suggestions de contrôle des risques :
- Optimisation des paramètres recommandée dans différents environnements de marché
- La reconnaissance des signaux peut être combinée avec d'autres indicateurs techniques
- Adapter les paramètres de stop loss et stop loss de manière appropriée pour s'adapter aux différentes volatilités du marché
Orientation de l'optimisation de la stratégie
-
Optimisation du mécanisme de confirmation des signaux:
- Accroissement des conditions de confirmation de la livraison
- Ajouter un filtre de force de tendance
- Introduction d'un mécanisme adaptatif à la volatilité
-
Optimisation de la gestion des risques :
- Mise en place d'un mécanisme de stop loss dynamique
- Ajout d'un module de gestion de fonds
- Mise en place d'un mécanisme de construction et de réduction des stocks par lots
-
Optimisation des paramètres:
- Développement d'un mécanisme d'ajustement des paramètres d'adaptation
- Réalisation d'une commutation de paramètres basée sur l'environnement du marché
- Ajout d'un modèle d'apprentissage automatique pour une optimisation des paramètres
Résumer
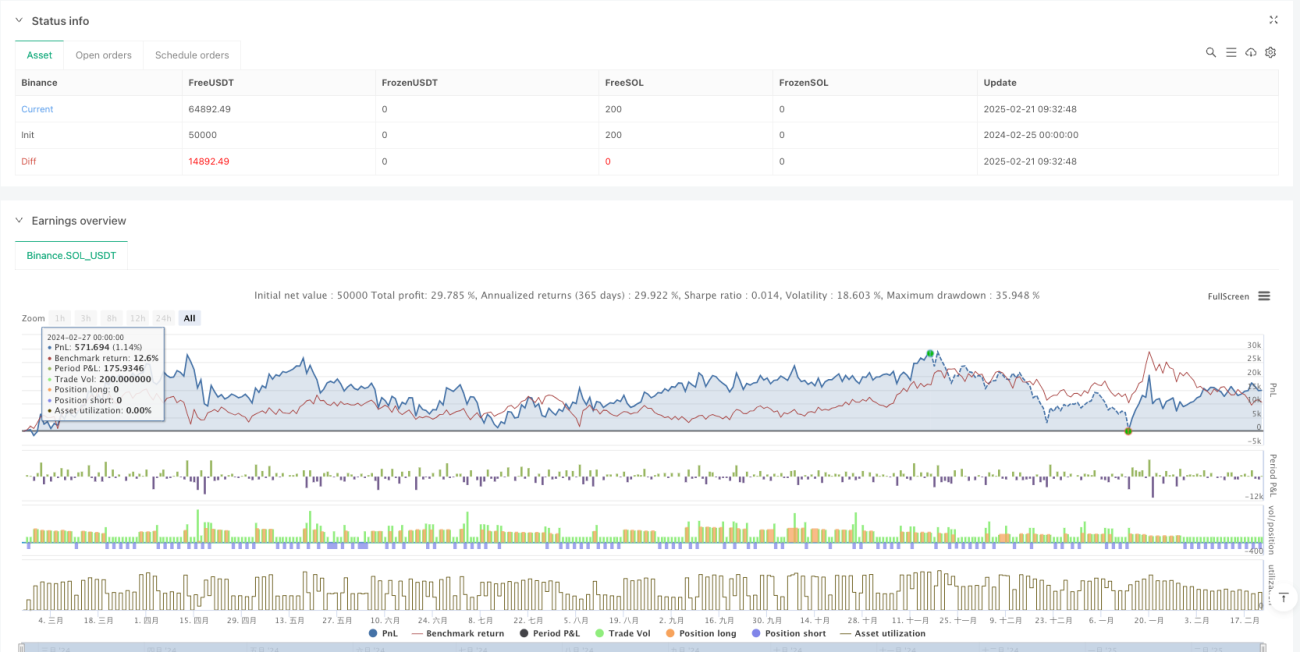
La stratégie est principalement caractérisée par la combinaison de plusieurs indicateurs techniques et offre des options de configuration de paramètres flexibles. Bien qu'il existe un certain risque, la stratégie est susceptible de générer des rendements stables dans les transactions réelles grâce à un contrôle raisonnable du risque et à une optimisation continue. Il est recommandé aux traders de faire un retour d'expérience suffisant avant de l'utiliser sur le terrain et d'ajuster les paramètres de manière appropriée en fonction des conditions spécifiques du marché.
/*backtest
start: 2024-02-25 00:00:00
end: 2025-02-22 08:00:00
period: 1d
basePeriod: 1d
exchanges: [{"eid":"Binance","currency":"SOL_USDT"}]
*/

//@version=5
strategy("EMA-Based Net Volume Oscillator with Trend Change", shorttitle="NVO Trend Change", overlay=false, initial_capital=100000, default_qty_type=strategy.percent_of_equity, default_qty_value=100)

// Input parameters- 1