Stratégie quantitative de stop loss dynamique à double croisement EMA

Aperçu
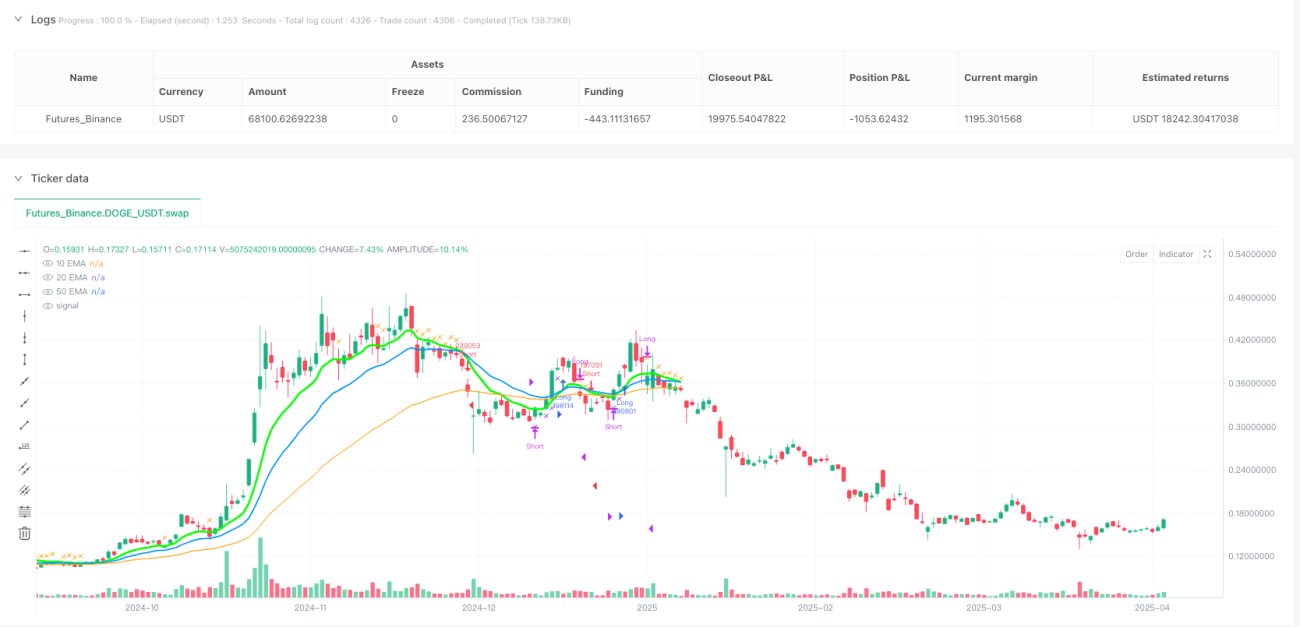
La stratégie est basée sur le double croisement des moyennes mobiles indicielles (EMA) et est conçue en combinaison avec un mécanisme de stop-loss dynamique. La stratégie utilise l'EMA du 10e jour et l'EMA du 20e jour comme signaux de négociation principaux, et le 50e jour comme filtre de tendance, tout en utilisant l'EMA du 10e jour comme ligne de stop-loss dynamique.
Principe de stratégie
- Détermination du nombre d'espaces:
- Condition de plusieurs têtes: la confirmation de la tendance à plusieurs têtes est établie lorsque l'EMA de 10 jours traverse l'EMA de 20 jours par le bas et que la clôture actuelle est supérieure à l'EMA de 50 jours.
- Condition de tête creuse: la tendance à la tête creuse est confirmée lorsque l'EMA du 10e jour traverse l'EMA du 20e jour par le haut et que le prix de clôture actuel est inférieur à l'EMA du 50e jour.
- Système d'arrêt dynamique:
- Pendant la période de multiposition, si le cours de clôture tombe au-dessous de l'EMA du 10e jour, un arrêt de perte est déclenché.
- Pendant la période de détention à vide, si le cours de clôture dépasse l'EMA du 10e jour, un arrêt de perte est déclenché.
- Filtrage des tendancesL'EMA à 50 jours sert de filtre de tendance à long terme pour éviter les échanges fréquents dans des conditions de choc.
Analyse des avantages
- Capacité à suivre les tendancesLe double croisement EMA est efficace pour capturer les tendances intermédiaires, et le filtre EMA à 50 jours réduit les faux signaux.
- Gestion dynamique des risquesLe 10e EMA est une ligne de stop-loss dynamique qui peut être ajustée en fonction de la tendance pour protéger les bénéfices.
- Conception visuelle: Distinguer les trois EMA en différentes couleurs et largeurs de ligne, et marquer les signaux d'achat et de vente pour faciliter la surveillance en temps réel.
- Ajustabilité des paramètres: Le cycle EMA peut être ajusté de manière flexible pour s'adapter aux fluctuations du marché en fonction des paramètres d'entrée.
Analyse des risques
- Risque de retardL'EMA a calculé sur la base des données historiques que des retraits plus importants sont possibles dans un contexte de reprise rapide.
- Une solution: Indicateur de la dynamique combinée ((comme le RSI) filtre les fluctuations extrêmes.
- Les pertes des marchés en criseLes signaux de croisement peuvent souvent déclencher des transactions invalides dans des conditions sans tendance.
- Une solutionLe taux d'inflation est le taux de change le plus élevé de l'année.
- Paramètres sur-adaptésLes cycles EMA fixes peuvent ne pas s'adapter à toutes les conditions du marché.
- Une solution: Validation à l'aide d'algorithmes cycliques adaptatifs ou multi-temps.
Direction d'optimisation
- Amélioration du signal composite:
- Augmentation de la confirmation de la transaction (par exemple, amplification lors de la percée), amélioration de la fiabilité du signal.
- Gestion dynamique des positions:
- Ajustez la taille de votre position en fonction de la volatilité (ATR) pour réduire l'exposition à des périodes de risque élevé.
- Optimisation du machine learning:
- Optimisation dynamique du portefeuille de cycles EMA à l'aide de modèles de formation basés sur des données historiques.
- Vérification de plusieurs périodes:
- Il faut que la direction de l'EMA au niveau de la circonférence soit en accord avec le signal de la ligne solaire, ce qui améliore le taux de réussite.
Résumer
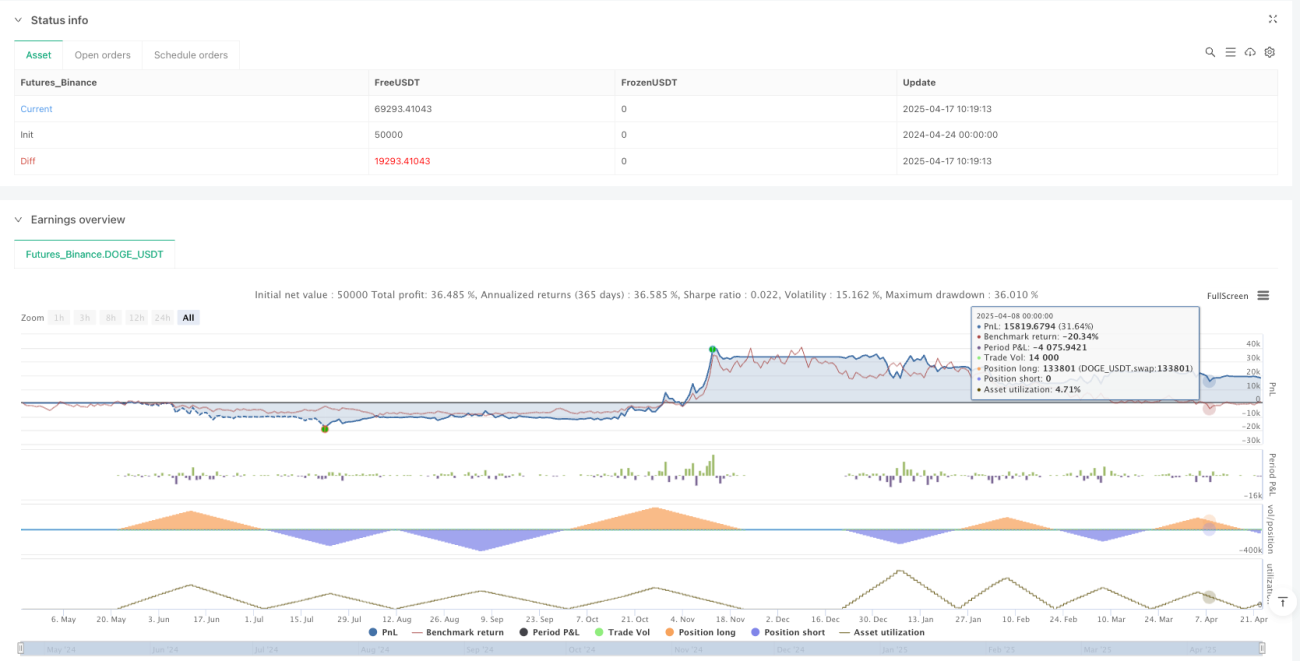
Cette stratégie, combinant double croisement EMA et stop loss dynamique, réalise un équilibre entre le suivi de la tendance et la maîtrise du risque. Son avantage central réside dans la structure logique claire et la conception visuelle intuitive, adaptée aux scénarios de négociation à faible ou moyenne fréquence. La stabilité peut être encore améliorée à l'avenir en introduisant des données de marché plus dimensionnelles (comme la volatilité, le volume de transactions).
- 1