
Aperçu
La stratégie de suivi de tendance adaptative multi-facteurs ALMA-ATR est un système de trading complet qui combine plusieurs indicateurs techniques pour optimiser les points d'entrée et de sortie. Son cœur repose sur l'utilisation de l'ALMA (Moyenne mobile d'Arnaud Legoux) comme principal outil de détermination de la tendance, tout en intégrant un filtre de volatilité ATR, une confirmation de momentum RSI, une validation de force de tendance ADX et un mécanisme de contrôle de volatilité basé sur les bandes de Bollinger. La stratégie intègre également le système UT Bot, un système de stop suiveur et de signal basé sur l'ATR, afin d'améliorer la précision des sorties de transaction.
Principes de la stratégie
Le principe fondamental de cette stratégie est d'effectuer des transactions via la synergie de multiples indicateurs techniques, en s'assurant que la tendance est claire et la volatilité modérée. Plus précisément :
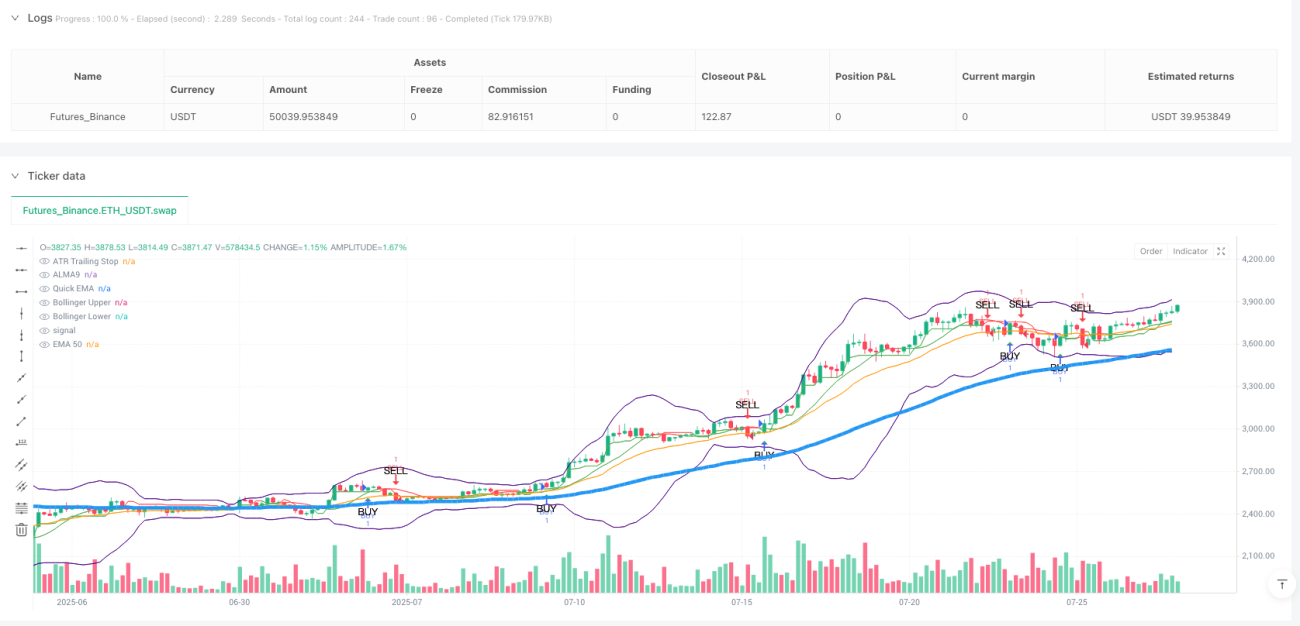
- Utilisation de l'ALMA comme indicateur de tendance principal, qui présente une courbe plus lisse et un décalage réduit par rapport aux EMA ou SMA traditionnelles.
- Mise en place d'un filtre de volatilité : exiger que la valeur ATR soit supérieure à un seuil minimum défini, garantissant une volatilité suffisante sur le marché.
- Conditions d'entrée : le prix est au-dessus de l'EMA50 et de l'ALMA9, le RSI est supérieur au niveau de survente et supérieur à 30, l'ADX est supérieur à 30 (indiquant une tendance forte), le prix est en dessous de la bande supérieure de Bollinger, et la période de refroidissement est respectée.
- Conditions de sortie : le prix casse en dessous de l'EMA rapide, ou déclenche un stop loss/take profit basé sur l'ATR, ou atteint la condition de sortie temporelle.
- Intégration du système UT Bot, utilisant une ligne de stop suiveur basée sur l'ATR, offrant une couche de protection supplémentaire pour les transactions.
La stratégie adopte une approche dynamique de gestion des risques, avec des niveaux de stop loss et de take profit calculés à partir de l'ATR, ce qui lui permet de s'adapter aux variations de volatilité dans différentes conditions de marché.
Analyse des avantages
Cette stratégie présente plusieurs avantages significatifs :
- Mécanisme de confirmation multiple : en intégrant plusieurs indicateurs techniques (ALMA, RSI, ADX, bandes de Bollinger, etc.), elle améliore la fiabilité des signaux et réduit les faux signaux.
- Forte adaptabilité : les niveaux dynamiques de stop loss et de take profit basés sur l'ATR permettent à la stratégie de s'adapter aux changements de volatilité du marché.
- Capture efficace des tendances : le faible décalage de l'ALMA, combiné à la confirmation de force de l'ADX, aide à capturer rapidement les changements de tendance.
- Gestion des risques complète : grâce au filtre de volatilité, au stop loss dynamique et au mécanisme de période de refroidissement, elle offre une protection multi-niveaux contre les risques.
- Visualisation claire : la stratégie marque les signaux d'achat et de vente sur le graphique, permettant aux traders de comprendre intuitivement les conditions du marché.
- Haute flexibilité : par ajustement des paramètres, la stratégie peut s'adapter à différents environnements de marché et périodes de trading.
Analyse des risques
Bien que la stratégie soit relativement bien conçue, les risques potentiels suivants subsistent :
- Risque de suroptimisation des paramètres : une optimisation excessive peut donner de bons résultats sur des données historiques mais s'avérer inefficace en trading réel.
Solution : utiliser des tests forward et des données hors échantillon pour valider la robustesse des paramètres. - Risque de retournement de tendance : lors de retournements de tendance violents, la stratégie peut ne pas réagir assez rapidement, entraînant une perte de gains.
Solution : envisager d'ajouter des indicateurs d'alerte de retournement, comme un oscillateur de momentum ou une analyse de volume. - Risque de sur-négociation : dans un marché rangeant, la stratégie peut générer trop de signaux.
Solution : renforcer les conditions de filtre de volatilité, ou suspendre les transactions après identification d'un marché rangeant. - Risque de piège à stop loss : le marché peut déclencher un stop loss puis reprendre rapidement la tendance initiale.
Solution : envisager d'utiliser une stratégie de stop loss fractionné ou d'ajuster dynamiquement le multiple du stop loss en fonction des conditions du marché. - Risque de retard : bien que l'ALMA ait un faible décalage, tous les indicateurs techniques présentent intrinsèquement un certain retard.
Solution : envisager d'ajouter des indicateurs avancés ou d'optimiser les paramètres de l'ALMA.
Axes d'optimisation
Sur la base de l'analyse de la stratégie, les axes d'optimisation suivants sont suggérés :
- Classification des états de marché : introduire un mécanisme d'identification des états de marché, afin d'utiliser différents réglages de paramètres selon l'état (tendance, range, forte volatilité, etc.). Cela améliore l'adaptabilité de la stratégie dans divers environnements.
- Intégration du volume : ajouter l'indicateur de volume comme outil auxiliaire de confirmation de tendance, ce qui peut améliorer la fiabilité des signaux.
- Analyse multi-timeframes : introduire un mécanisme de confirmation multi-timeframes pour s'assurer que la direction de trading est cohérente avec la tendance de l'unité de temps supérieure.
- Optimisation par machine learning : utiliser des algorithmes de machine learning pour ajuster dynamiquement les paramètres, ou prédire les meilleurs points d'entrée/sortie.
- Amélioration de la stratégie de take profit : mettre en œuvre un take profit fractionné ou un take profit dynamique basé sur la structure du marché pour améliorer l'efficacité d'utilisation des capitaux.
- Score de qualité du signal : développer un système de notation de la qualité des signaux, n'exécutant les transactions que lorsque l'intensité du signal dépasse un seuil spécifique.
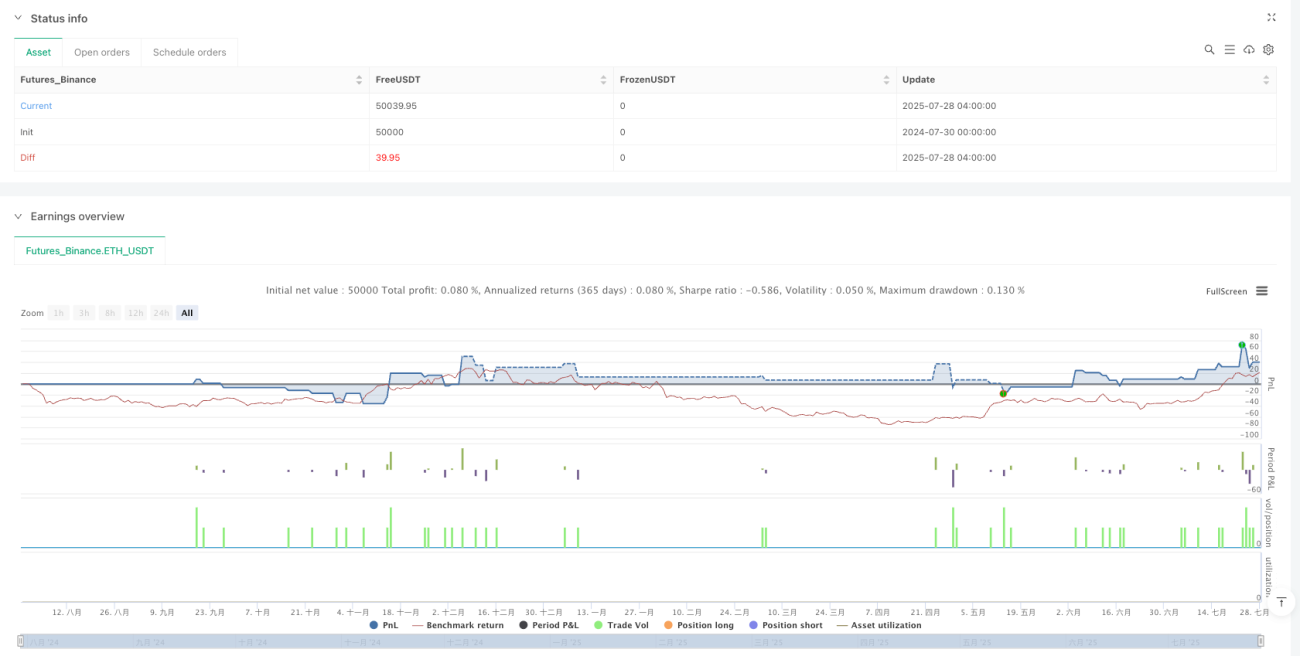
- Contrôle du drawdown : introduire un mécanisme de gestion globale de la taille des positions, réduisant les positions ou suspendant les transactions lorsque le drawdown dépasse un certain niveau.
L'objectif de ces axes d'optimisation est d'améliorer la robustesse de la stratégie, de réduire le drawdown et de maintenir des performances cohérentes dans différents environnements de marché.
Résumé
La stratégie de suivi de tendance adaptative multi-facteurs ALMA-ATR est un système de trading complet avec une gestion des risques solide. En intégrant des outils techniques tels que l'ALMA, l'ATR, le RSI, l'ADX, les bandes de Bollinger et le système UT Bot, elle permet d'identifier efficacement les tendances, de filtrer le bruit, de contrôler les risques et d'entrer/sortir aux moments appropriés. Son principal avantage réside dans son mécanisme de confirmation multiple et son système de gestion des risques adaptatif, lui permettant de maintenir des performances stables dans différents environnements de marché.
Néanmoins, toute stratégie de trading est confrontée aux défis de l'incertitude du marché. Grâce à une optimisation continue des paramètres, à l'introduction de la classification des états de marché, à l'intégration de l'analyse multi-timeframes, cette stratégie possède encore un potentiel d'amélioration important. Pour les traders quantitatifs, il s'agit d'une stratégie dotée d'un cadre de base solide, qui peut être personnalisée et optimisée en fonction de leur appétit pour le risque et de leur compréhension du marché.
- 1