EMA inFusion Pro Stratégie de fusion de données multi-sources

🎯 Point fort principal de la stratégie : une stratégie EMA qui ne se limite pas au prix
Saviez-vous que la plupart des gens utilisent l'EMA uniquement pour le prix ? Mais ce qui rend cette stratégie puissante, c'est qu'elle peut calculer l'EMA à partir de 6 sources de données différentes ! C'est comme cuisiner : on n'utilise pas seulement du sel, mais aussi du sucre, du vinaigre, de la sauce soja, pour obtenir des signaux de trading plus riches.
À retenir ! Ces 6 sources de données incluent : le prix normal, le volume, le taux de variation, le prix moyen des bougies (Heikin-Ashi), le volume moyen des bougies, le taux de variation moyen des bougies. Chacune offre une perspective de marché différente !
📊 Système de triple filtre : des signaux plus précis
Cette stratégie ne donne pas de signaux au hasard ! Elle dispose de trois niveaux de « contrôle de sécurité » :
1ᵉʳ niveau : Tendance EMA 📈
Comme une météo, on détermine d'abord la tendance générale : beau ou pluvieux.
2ᵉ niveau : Filtre de force ADX 💪
L'ADX est comme un instrument mesurant la force du vent. Le signal n'est émis que si la tendance est suffisamment forte (par défaut au-dessus de 25). Cela évite de se faire piéger dans un marché en range !
3ᵉ niveau : Confirmation par le volume 🔊
Une augmentation soudaine du volume, c'est comme si l'action « parlait fort », preuve que le signal est sérieux, pas une blague.
🎮 Trois modes de sortie : adaptés à différents styles de trading
Le plus agréable, c'est que cette stratégie propose 3 modes de sortie, comme les niveaux de difficulté facile, normal, difficile dans un jeu :
Mode 1 : Sortie sur signal inverse 🔄
Le plus simple : un signal long ferme la position short et ouvre une position long, un signal short ferme la position long et ouvre une position short.
Mode 2 : Stop-Loss/Take-Profit dynamique basé sur l'ATR 📏
Ajustement automatique en fonction de la volatilité du marché : stop plus large quand la volatilité est élevée, plus serré quand elle est faible.
Mode 3 : Stop-Loss/Take-Profit fixe en pourcentage 📊
Le plus compréhensible : prendre profit à 2 %, stop-loss à 1,5 % (paramétrable).
🚀 Conseils pratiques d'application
Périodes adaptées : Trading à court/moyen terme, particulièrement adapté aux marchés avec une certaine volatilité.
Pièges à éviter : Attention dans les marchés en range, il est conseillé d'activer le filtre ADX.
Utilisation avancée : Vous pouvez essayer différentes sources de données ; la source volume est particulièrement efficace lors des cassures avec volume !
Le plus grand avantage de cette stratégie est sa flexibilité : vous pouvez choisir la source de données et le mode de sortie les plus adaptés selon les conditions de marché. Rappelez-vous : il n'existe pas de stratégie parfaite, seulement celle qui est la mieux adaptée au marché actuel !
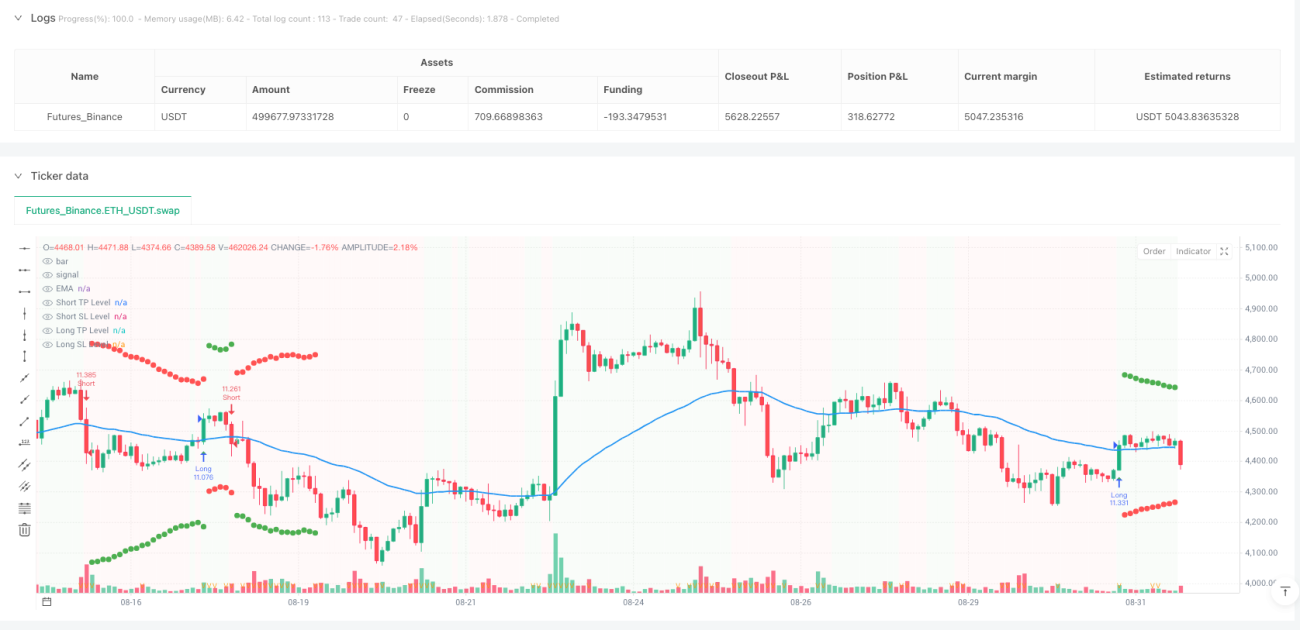
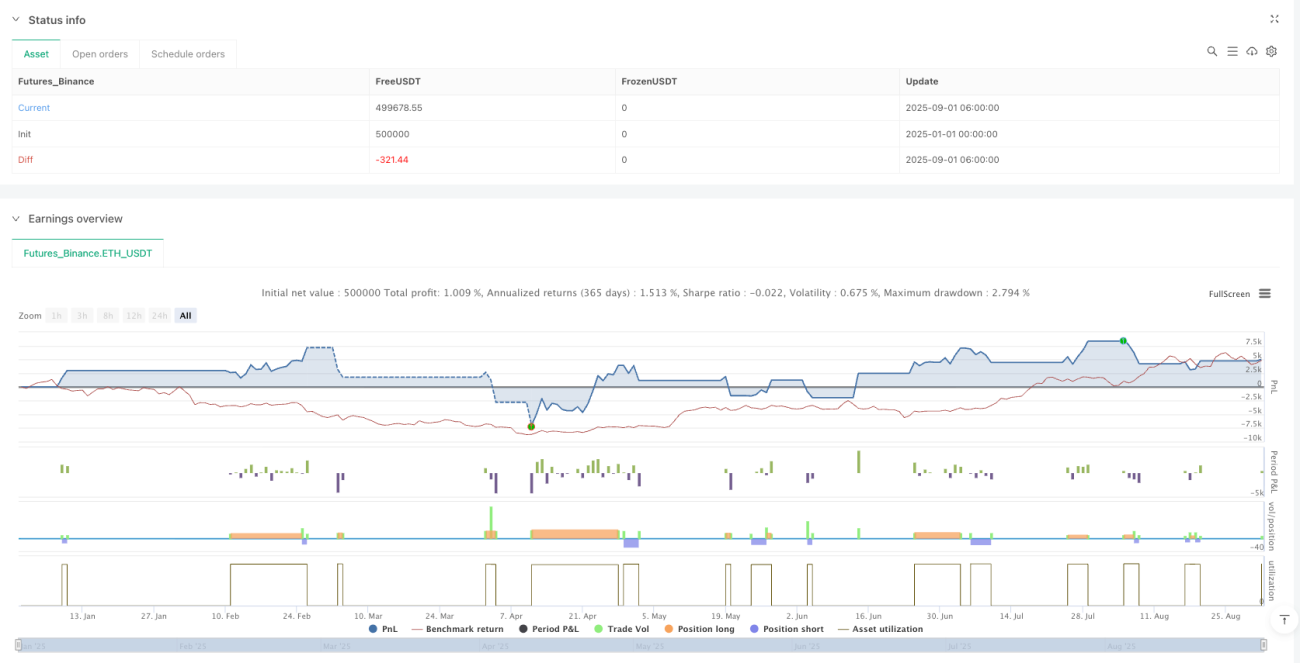
/*backtest
start: 2025-01-01 00:00:00
end: 2025-09-01 08:00:00
period: 2h
basePeriod: 2h
exchanges: [{"eid":"Futures_Binance","currency":"ETH_USDT","balance":500000}]
*/

//@version=5
//@fenyesk
strategy("EMA inFusion Pro - Source Selection", overlay=true, initial_capital=10000, default_qty_type=strategy.percent_of_equity, default_qty_value=10)
- 1