Stratégie de multiplicateur de paramètres : Métronome du marché à indicateurs multiples fusionnés

🎯 Quelle est cette stratégie de génie ?
Vous savez quoi ? Cette stratégie équipe le marché d’un « super radar » ! Elle ne se contente pas d’observer un ou deux indicateurs, mais combine 9 indicateurs techniques différents comme un orchestre – chaque indicateur est un « instrument » et ce n’est que lorsque tous jouent une « note » harmonieuse que la stratégie émet un signal de trading. Imaginez : c’est comme si 9 experts vous chuchotaient leurs conseils en même temps, et vous n’agissez que lorsque la majorité est d’accord !
📊 Révélation du principe fondamental
Point essentiel ! Le cœur de cette stratégie réside dans le concept de « multiplicateur de paramètres ». Elle normalise d’abord les indicateurs RSI, ADX, Momentum, Rate of Change, ATR, Volume, Accélération et Pente sur une même échelle, puis les multiplie entre eux pour obtenir une « valeur de force composite ». C’est comme en cuisine : chaque épice a son dosage optimal, et cette stratégie trouve le parfait équilibre entre tous les « assaisonnements » du marché ! Lorsque la valeur de force composite traverse sa moyenne mobile, c’est le moment idéal pour entrer en position.
🔧 Un outil de trading personnalisable
Ce qu’il y a de plus cool dans cette stratégie ? Vous pouvez l’assembler comme des blocs de construction ! Vous ne voulez pas utiliser un indicateur ? Il suffit de le désactiver. Vous souhaitez ajuster les paramètres de période ? Faites comme bon vous semble. Il y a même un filtre de tendance SMA pour vous aider à éviter les pièges des trades à contre-tendance. C’est comme un « kit de bricolage de stratégie de trading » qui vous permet d’adapter la configuration aux différentes conditions de marché.
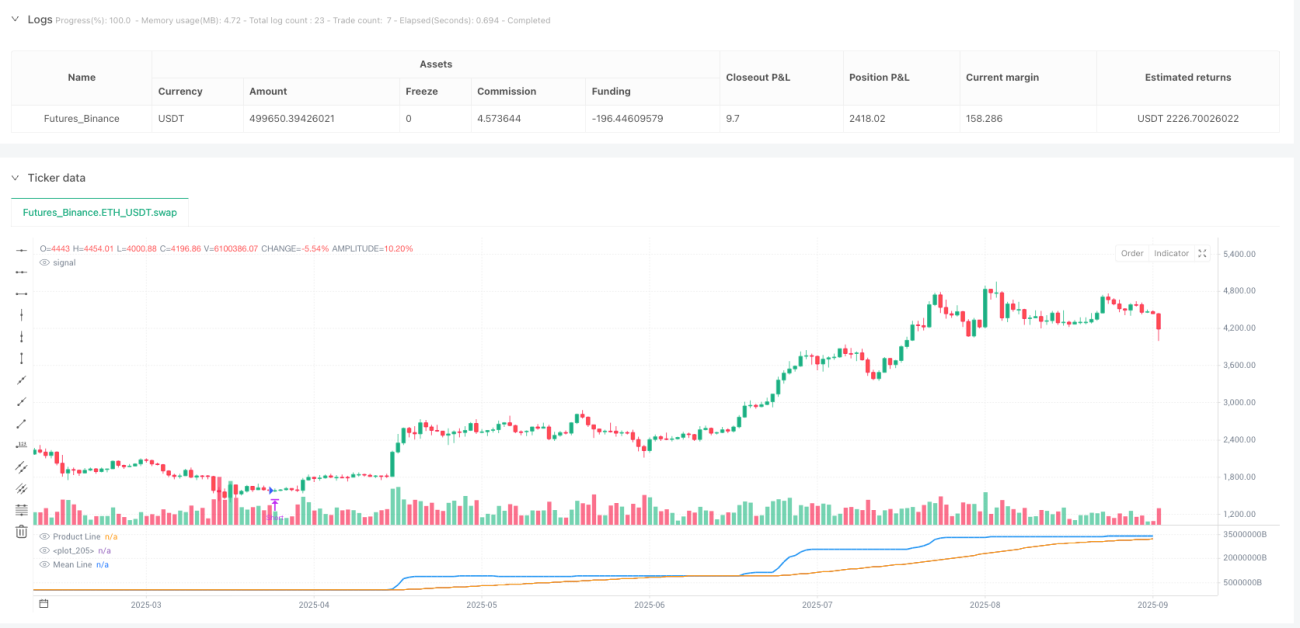
⚡ Guide pratique d’application
Voici le guide anti-piège ! Cette stratégie est particulièrement adaptée aux marchés mêlant phases de range et de tendance. Quand la ligne bleue du produit croise à la hausse la moyenne mobile orange, on achète ; quand elle croise à la baisse, on vend. La stratégie inclut également un mécanisme de clôture automatique pour éviter de rester en position bêtement quand un signal inverse se présente. N’oubliez pas : activer le filtre de tendance vous permet de naviguer sereinement dans les grandes tendances, tandis que le désactiver vous aidera à capturer davantage d’opportunités à court terme !
//@version=5
strategy("Parametric Multiplier Backtester", shorttitle="PMB", overlay=false)

// Author: Script_Algo
// License: MIT
// Permission is hereby granted, free of charge, to any person obtaining a copy
// of this software and associated documentation files (the "Software"), to deal
// in the Software without restriction, including without limitation the rights
// to use, copy, modify, merge, publish, distribute, sublicense, and/or sell
// copies of the Software, subject to the following conditions:
// The above copyright notice and this permission notice shall be included in
// all copies or substantial portions of the Software.- 1