
नए उपयोगकर्ता पायथन परीक्षण एपीआई दस्तावेज़ में कोड, त्रुटि, मदद के लिए पूछें।
import matplotlib.pyplot as plt
import json
def main():
plt.plot([3,6,2,4,7,1])
LogStatus(plt)
table = {type: 'table', title: 'निवेश जानकारी', cols: ['कॉलम 1', 'कॉलम 2'], rows: [ ['abc', 'def'], ['ABC', 'support color #ff0000']]}
LogStatus('' + JSON.stringify(table)+'') # JSON अनुक्रमण के बाद दोनों पक्षों को जोड़ना字符, 视为一个复杂消息格式(当前支持表格) LogStatus('第一行消息\n' + JSON.stringify(table)+'\n第三行消息') # 表格信息也可以在多行中出现 LogStatus('' + JSON.stringify([table, table])+'`') # एक ही समय में कई तालिकाओं का समर्थन करता है, टैब के रूप में एक समूह में प्रदर्शित किया जाएगा

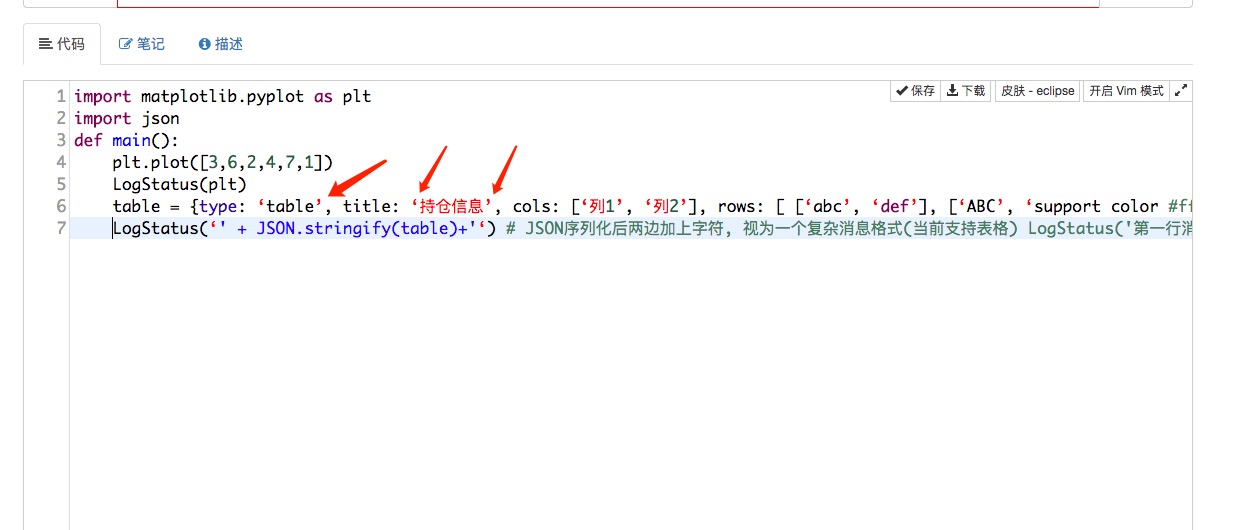
第一眼看到 代码,发现 问题应该是 你写的时候 单引号 ' 使用 中文输入了 ‘ , 这两个字符是不一样的,所以初学者需要注意的是 编程的时候一定 是 英文状态的输入法。
并且在代码编辑框可以提前看出来, 出现这样的红色的字符 颜色提示 一般都是很明显的错误。
代码中还有几处错误
正确的代码:
import matplotlib.pyplot as plt
import json
def main():
plt.plot([3,6,2,4,7,1])
LogStatus(plt)
table = {"type" : 'table', "title": '持仓信息', "cols": ['列1', '列2'], "rows": [ ['abc', 'def'], ['ABC', 'support color #ff0000']]}
LogStatus('`' + json.dumps(table) + '`') # JSON序列化后两边加上字符, 视为一个复杂消息格式(当前支持表格) LogStatus('第一行消息\n‘ + JSON.stringify(table)+’\n第三行消息') # 表格信息也可以在多行中出现 LogStatus('‘ + JSON.stringify([table, table])+’`’) # 支持多个表格同时显示, 将以TAB显示到一组里
可以对比下 找找不同!
运行回测:
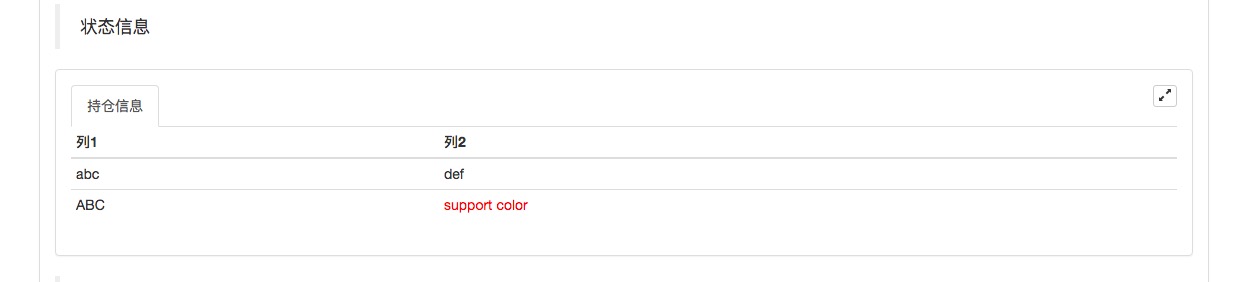
显示为表格,之前的 折线图就不显示了。
- 1