एमएसीडी गतिशील अस्थिरता क्रॉसओवर भविष्यवाणी रणनीति

अवलोकन
यह रणनीति MACD की गतिशील परिवर्तनशील विशेषताओं पर आधारित है। रणनीति का मूल यह है कि MACD स्तंभों के परिवर्तनशील रुझानों को देखकर संभावित गोल्डफोर्क और डेडफोर्क का अनुमान लगाया जा सकता है, जिससे ट्रेडों को पहले से तैयार किया जा सके। यह रणनीति पारंपरिक MACD सूचक क्रॉस सिग्नल पर ध्यान केंद्रित करने के बजाय, स्तंभों के परिवर्तनशील विशेषताओं पर ध्यान केंद्रित करती है, जो क्रॉस सिग्नल के पूर्वनिर्धारित तरीके से बेहतर प्रवेश समय प्राप्त करती है।
रणनीति सिद्धांत
रणनीति में एक सुधारित MACD सूचक प्रणाली का उपयोग किया गया है, जिसमें तेजी से चलती औसत ((EMA12) और धीमी गति से चलती औसत ((EMA26) के अंतर के साथ-साथ 2 चक्रों पर आधारित सिग्नल लाइन शामिल है। कोर ट्रेडिंग तर्क निम्नलिखित कुछ महत्वपूर्ण बिंदुओं पर आधारित हैः
- प्रवृत्ति की गतिशीलता का आकलन करने के लिए एक स्तंभ के परिवर्तन की दर (hist_change) की गणना करें
- जब एक ध्रुवीय आरेख नकारात्मक होता है और लगातार तीन चक्रों में एक उछाल होता है, तो पूर्वानुमान एक सुनहरा कांटा सिग्नल हो सकता है, जो पहले से अधिक प्रवेश करता है
- जब स्तंभ रेखा सकारात्मक होती है और लगातार तीन चक्रों में गिरावट की प्रवृत्ति दिखाती है, तो पूर्वानुमान एक मृत-फोकस संकेत हो सकता है, और एक बराबरी का खेल बाहर निकलता है
- समय फ़िल्टरिंग तंत्र को लागू करने वाली रणनीति, केवल निर्दिष्ट समय सीमा के भीतर व्यापार करें
रणनीतिक लाभ
- सिग्नल पूर्वानुमानात्मकः संभावित क्रॉस सिग्नल को पहले से अनुमान लगाने के लिए कॉलम आरेख की गतिशीलता को देखते हुए, प्रवेश समय को प्रभावी ढंग से बढ़ाएं
- उचित जोखिम नियंत्रणः 0.1% प्रसंस्करण शुल्क और 3 स्लाइड बिंदुओं के लिए लेनदेन की लागत, वास्तविक लेनदेन की स्थिति के अनुरूप
- धन प्रबंधन में लचीलापनः खाते के कुल मूल्य का प्रतिशत स्थिति प्रबंधन के लिए, जोखिम को प्रभावी ढंग से नियंत्रित करने के लिए
- उत्कृष्ट दृश्य प्रभावः विभिन्न रंगों में चिह्नित स्तंभों का उपयोग करें और ट्रेडिंग संकेतों को तीरों के माध्यम से चिह्नित करें ताकि विश्लेषण करना आसान हो सके
रणनीतिक जोखिम
- झूठे ब्रेकआउट का जोखिमः बाज़ारों में अकसर झूठे ब्रेकआउट के संकेत मिल सकते हैं
- पिछड़ेपन का जोखिमः पूर्व-निर्णय तंत्र के बावजूद, MACD स्वयं कुछ पिछड़ापन है
- बाजार की स्थिति पर निर्भरताः रणनीति स्पष्ट रूप से ट्रेंडिंग बाजारों में बेहतर प्रदर्शन करती है, और अस्थिर बाजारों में खराब प्रदर्शन कर सकती है
- पैरामीटर संवेदनशीलताः नीति प्रदर्शन पर अधिक प्रभाव के लिए धीमी गति से लाइन चक्र की सेटिंग
रणनीति अनुकूलन दिशा
- बाजार परिदृश्य फ़िल्टर का परिचयः प्रवृत्ति के लिए एक सूचक जोड़ें, विभिन्न बाजार परिदृश्यों के लिए अलग-अलग लेनदेन मापदंडों का उपयोग करें
- अनुकूलित स्थिति प्रबंधनः सिग्नल की ताकत के आधार पर गतिशील रूप से समायोज्य स्थिति अनुपात
- लॉस-स्टॉप को बेहतर बनानाः ट्रैक किए गए लॉस या फिक्स्ड लॉस को वापस लेने के लिए जोड़ना
- सिग्नल पुष्टिकरण तंत्र में वृद्धिः सिग्नल विश्वसनीयता में सुधार के लिए अन्य तकनीकी संकेतकों के साथ क्रॉस-सत्यापन
- अनुकूलित पैरामीटर चयनः बाजार की स्थिति के अनुसार संकेतक पैरामीटर को गतिशील रूप से समायोजित करने के लिए अनुकूलित पैरामीटर विधि का उपयोग किया जा सकता है
संक्षेप
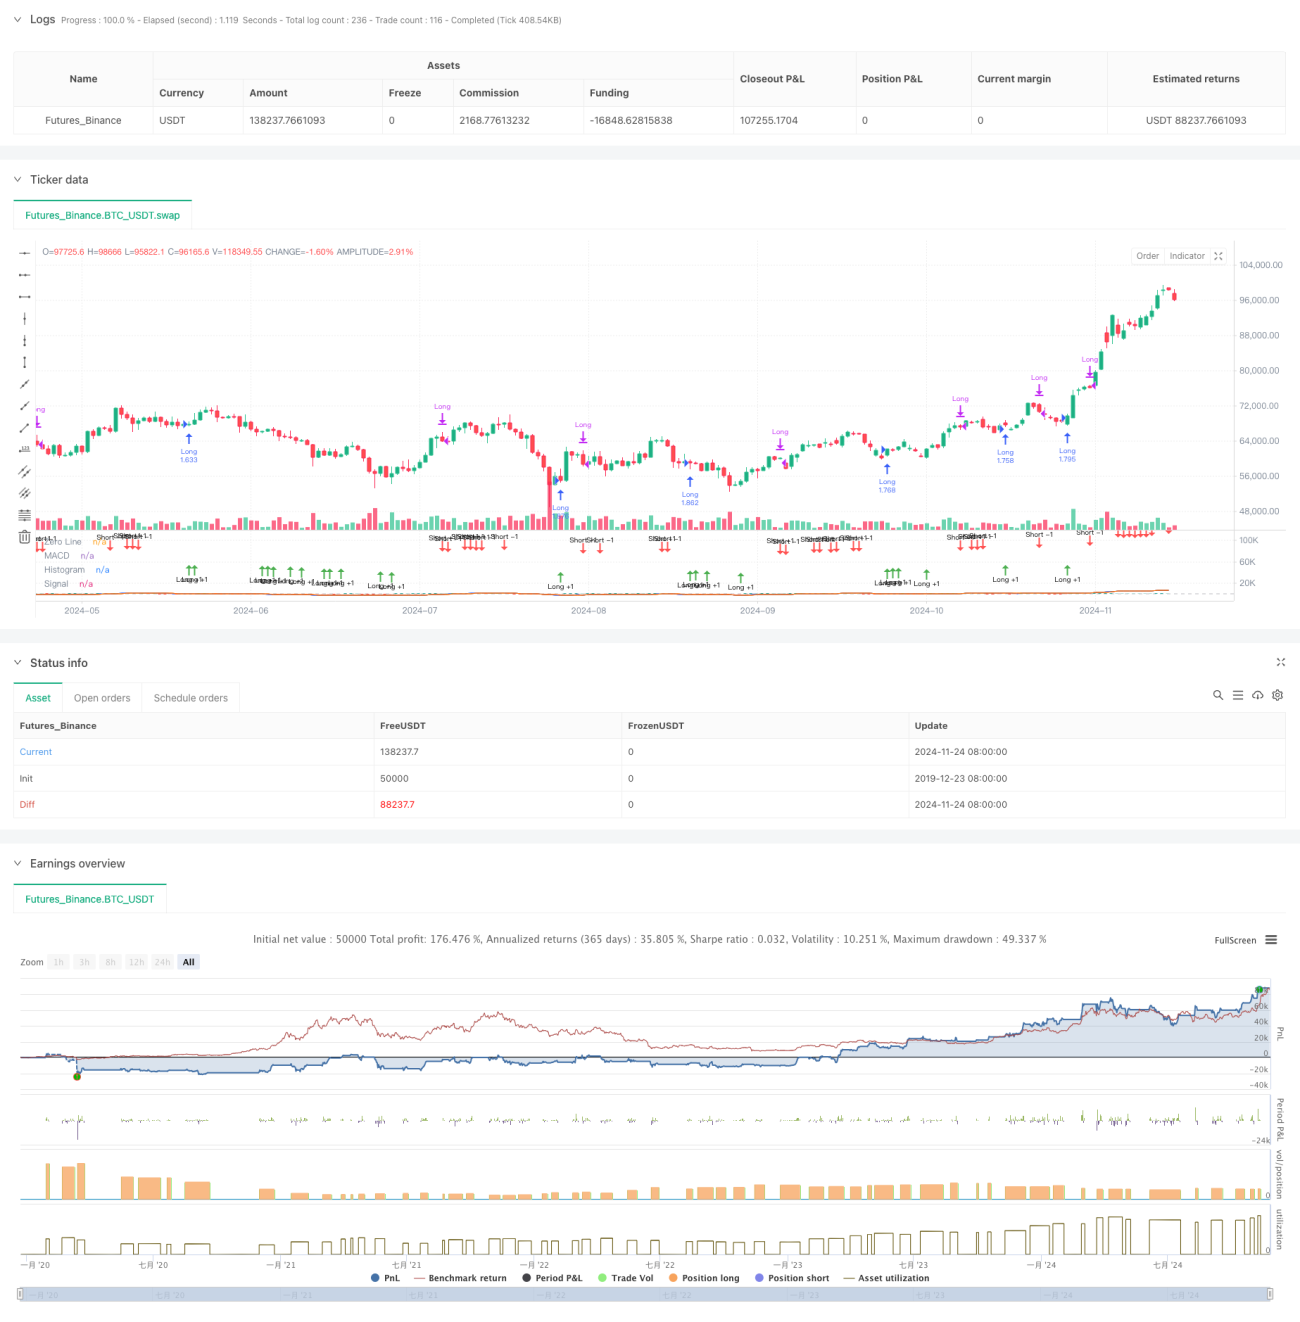
इस रणनीति में MACD स्तंभों की गतिशील परिवर्तन विशेषताओं का अभिनव उपयोग किया गया है, जिससे पारंपरिक MACD ट्रेडिंग सिस्टम में सुधार और अनुकूलन किया जा सकता है। रणनीति की पूर्व-निर्णय प्रणाली पहले प्रवेश संकेत प्रदान करने में सक्षम है, जबकि सख्त ट्रेडिंग शर्तें और जोखिम नियंत्रण उपाय रणनीति की स्थिरता सुनिश्चित करते हैं। आगे के अनुकूलन और सुधार के माध्यम से, रणनीति को वास्तविक व्यापार में बेहतर प्रदर्शन करने की उम्मीद है।
/*backtest
start: 2019-12-23 08:00:00
end: 2024-11-25 08:00:00
period: 1d
basePeriod: 1d
exchanges: [{"eid":"Futures_Binance","currency":"BTC_USDT"}]
*/

//@version=5
strategy(title="Demo GPT - Moving Average Convergence Divergence", shorttitle="MACD", commission_type=strategy.commission.percent, commission_value=0.1, slippage=3, default_qty_type=strategy.percent_of_equity, default_qty_value=100)

// Getting inputs- 1