
अवलोकन
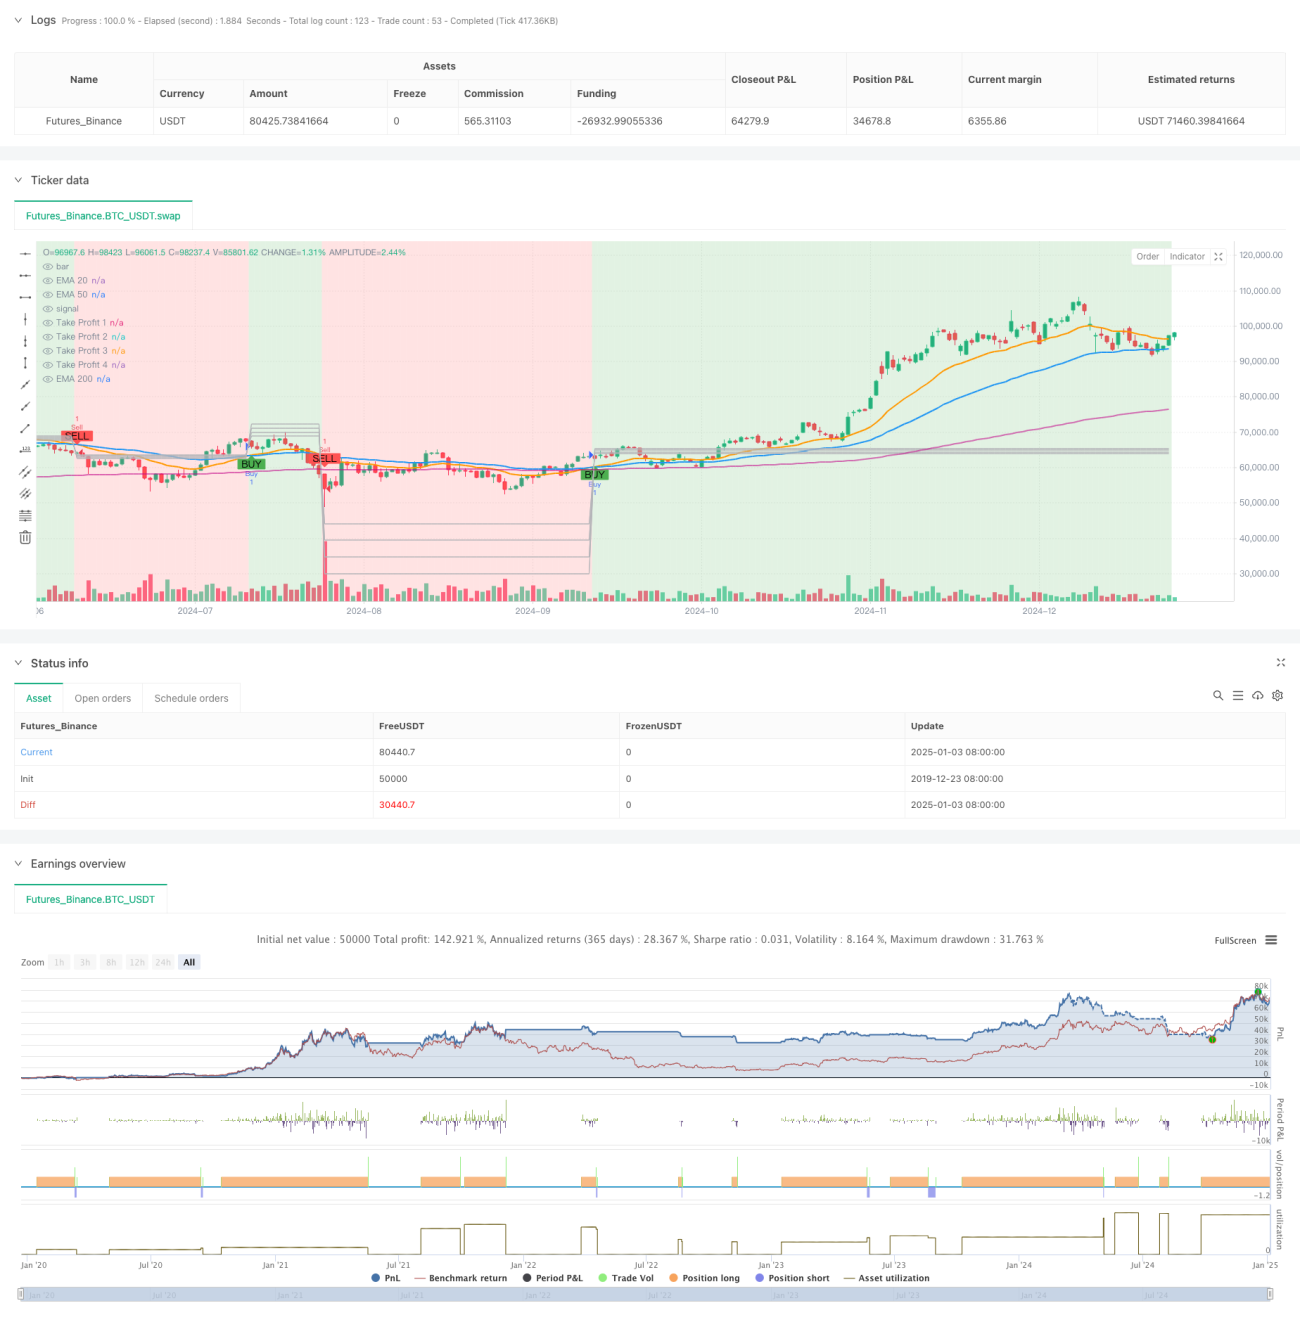
यह रणनीति एक्सपोनेंशियल मूविंग एवरेज (EMA) पर आधारित ट्रेडिंग सिस्टम है, जो मुख्य रूप से EMA20 और EMA50 के क्रॉसओवर का उपयोग करके बाजार के रुझान में बदलाव की पहचान करती है। रणनीति में गतिशील बहु-स्तरीय लाभ बिंदु डिज़ाइन किए गए हैं, और जोखिम को नियंत्रित करने के लिए स्टॉप-लॉस तंत्र शामिल है। सिस्टम पृष्ठभूमि रंग में परिवर्तन के माध्यम से बाजार की दिशा को स्पष्ट रूप से प्रदर्शित करता है, जो व्यापारियों को बाजार की चाल को बेहतर ढंग से समझने में मदद करता है।
रणनीति सिद्धांत
रणनीति का मूल तर्क निम्नलिखित पहलुओं पर आधारित है:
- EMA20 और EMA50 के क्रॉसओवर का उपयोग करके प्रवृत्ति दिशा निर्धारित करना: जब EMA20, EMA50 को ऊपर से पार करता है तो खरीद संकेत उत्पन्न होता है, और नीचे से पार करने पर बिक्री संकेत उत्पन्न होता है।
- पिछली कैंडल की अस्थिरता सीमा के आधार पर गतिशील रूप से चार लक्ष्य निर्धारित करना:
- TP1 को 0.5 गुना अस्थिरता सीमा पर सेट किया गया
- TP2 को 1.0 गुना अस्थिरता सीमा पर सेट किया गया
- TP3 को 1.5 गुना अस्थिरता सीमा पर सेट किया गया
- TP4 को 2.0 गुना अस्थिरता सीमा पर सेट किया गया
- जोखिम को नियंत्रित करने के लिए 3% का स्टॉप-लॉस बिंदु सेट करना
- कैंडल पृष्ठभूमि रंग में परिवर्तन के माध्यम से प्रवृत्ति दिशा प्रदर्शित करना: ऊपरी प्रवृत्ति हरा रंग, निचली प्रवृत्ति लाल रंग दिखाती है।
रणनीति के लाभ
- गतिशील लाभ बिंदु सेटिंग: बाजार की वास्तविक समय अस्थिरता के अनुसार स्वचालित रूप से लाभ लक्ष्य समायोजित करना, अनुकूलनशीलता अधिक होती है।
- बहु-स्तरीय लाभ तंत्र: कई लाभ बिंदु निर्धारित करके, लाभ सुरक्षित होता है और साथ ही प्रवृत्ति को पूरी तरह विकसित होने का स्थान मिलता है।
- उत्कृष्ट विज़ुअलाइज़ेशन प्रभाव: प्रवृत्ति दिशा पृष्ठभूमि रंग के माध्यम से स्पष्ट रूप से प्रदर्शित होती है, जिससे बाजार की स्थिति का त्वरित आकलन आसान होता है।
- पूर्ण जोखिम नियंत्रण: निश्चित स्टॉप-लॉस बिंदु सेट किया गया है, जो प्रत्येक ट्रेड में अधिकतम हानि को प्रभावी ढंग से नियंत्रित करता है।
- पैरामीटर लचीला और समायोज्य: व्यापारी विभिन्न बाजार स्थितियों के अनुसार लाभ बिंदु गुणक और स्टॉप-लॉस प्रतिशत समायोजित कर सकते हैं।
रणनीति के जोखिम
- मूविंग एवरेज की पिछड़ापन: EMA स्वाभाविक रूप से विलंबित होता है, जिससे संकेत उत्पन्न होने का समय देर से हो सकता है।
- साइडवे बाजार का जोखिम: साइडवे (रेंज) बाजार में बार-बार गलत संकेत उत्पन्न हो सकते हैं।
- निश्चित स्टॉप-लॉस सेटिंग: निश्चित प्रतिशत का स्टॉप-लॉस सभी बाजार स्थितियों के लिए उपयुक्त नहीं हो सकता।
- लाभ बिंदु अंतराल: अत्यधिक अस्थिर बाजार में लाभ बिंदुओं का अंतर बहुत बड़ा या बहुत छोटा हो सकता है।
रणनीति अनुकूलन दिशा-निर्देश
- सहायक संकेतक शामिल करना: क्रॉसओवर संकेतों की पुष्टि के लिए RSI या MACD जैसे संकेतक जोड़े जा सकते हैं।
- स्टॉप-लॉस तंत्र को अनुकूलित करना: गतिशील स्टॉप-लॉस दूरी सेट करने के लिए ATR का उपयोग विचार किया जा सकता है।
- समय फ़िल्टर जोड़ना: ट्रेडिंग समय विंडो जोड़ें, अत्यधिक अस्थिर अवधियों से बचें।
- स्थिति प्रबंधन में सुधार: बाजार अस्थिरता के अनुसार गतिशील रूप से स्थिति आकार समायोजित करें।
- संकेत पुष्टि अनुकूलन: सहायक पुष्टि के लिए वॉल्यूम जैसे संकेतक जोड़े जा सकते हैं।
निष्कर्ष
यह एक संरचनात्मक रूप से पूर्ण, तार्किक रूप से स्पष्ट ट्रेंड फॉलोइंग रणनीति है। मूविंग एवरेज क्रॉसओवर के माध्यम से प्रवृत्ति को कैप्चर करती है, गतिशील लाभ बिंदुओं के माध्यम से लाभ का प्रबंधन करती है, और स्टॉप-लॉस के साथ जोखिम को नियंत्रित करती है। रणनीति का विज़ुअलाइज़ेशन डिज़ाइन सहज और प्रभावी है, और पैरामीटर सेटिंग्स लचीली और समायोज्य हैं। हालांकि मूविंग एवरेज की अंतर्निहित पिछड़ापन एक समस्या है, अनुकूलन और सुधार के माध्यम से रणनीति की स्थिरता और लाभप्रदता को और बढ़ाया जा सकता है।
- 1