बहु-अवधि डोन्चियन संकेतक प्रवृत्ति अनुसरण और विचलन व्यापार रणनीति

अवलोकन
यह रणनीति कई चक्रों पर आधारित डोंगचीआन चैनल संकेतकों पर आधारित है। यह एक ट्रेंड ट्रैकिंग सिस्टम का निर्माण करती है। विभिन्न समय अवधि में डोंगचीआन चैनल के ब्रेकडाउन का विश्लेषण करके, मुख्य प्रवृत्ति और स्थानीय प्रवृत्ति के सहसंबंध को मिलाकर, एक दृश्य रूप से सहज प्रवृत्ति बैंड आरेख का निर्माण करती है। रणनीति प्रवृत्ति की ताकत और कमजोरी को दिखाने के लिए रंगों में गहरा परिवर्तन का उपयोग करती है, हरा क्षेत्र ऊपर की ओर प्रवृत्ति का प्रतिनिधित्व करता है, लाल क्षेत्र नीचे की ओर प्रवृत्ति का प्रतिनिधित्व करता है, रंग जितना गहरा होता है, प्रवृत्ति उतनी स्पष्ट होती है।
रणनीति सिद्धांत
रणनीति का केंद्र डोंचियन चैनल के आधार पर प्रवृत्ति का आकलन करना है। डोंचियन चैनल में उच्चतम मूल्य चैनल और निम्नतम मूल्य चैनल होते हैं, जो वर्तमान मूल्य और चैनल के स्थान संबंध की तुलना करके प्रवृत्ति का आकलन करते हैं। इसमें मुख्य रूप से निम्नलिखित कुछ महत्वपूर्ण घटक शामिल हैंः
- मुख्य प्रवृत्ति निर्णयः 20 चक्रों के साथ डोंगचीआन चैनल का उपयोग करना, जब कीमतों ने ऊपर की ओर प्रवृत्ति बनाई और नीचे की ओर प्रवृत्ति बनाई
- स्थानीय रुझानों का आकलन करनाः मुख्य रुझानों के ढांचे के तहत, स्थानीय रुझानों का आकलन करने के लिए छोटे चक्रों वाले डोंगचीआन चैनल का उपयोग करना
- ट्रेंड बैंड आरेखः 10 अलग-अलग चक्रों के साथ टोंगचियान चैनल संयोजन के माध्यम से ट्रेंड बैंड का गठन, प्रवृत्ति की ताकत को दर्शाते हुए रंग गहरा और हल्का
- ट्रेडिंग सिग्नलः मुख्य प्रवृत्ति ऊपर की ओर अधिक ऑर्डर खोले, मुख्य प्रवृत्ति नीचे की ओर खाली ऑर्डर खोले, प्रवृत्ति पलटाव के दौरान पोजीशन पोजीशन
रणनीतिक लाभ
- रुझानों का आकलन करनाः कीमतों के ब्रेकआउट के आधार पर रुझानों का आकलन करना, व्यक्तिपरक निर्णयों से विचलन से बचना
- बहु-चक्र सत्यापनः विभिन्न चक्रों के रुझानों को ओवरले करके रुझानों के आकलन की सटीकता में सुधार
- दृश्य प्रभाव सहज ज्ञान युक्तः रुझान पट्टी के रंग परिवर्तन सहज ज्ञान युक्त बाजार की स्थिति को प्रदर्शित करते हैं
- स्पष्ट व्यापार नियमः प्रवेश और निकास संकेत स्पष्ट हैं, जो प्रोग्रामेटिक रूप से लागू करने में मदद करते हैं
- अनुकूलनशीलता: व्यापारिक किस्मों की विशेषताओं के आधार पर पैरामीटर को अनुकूलित करने के लिए रणनीति प्रदर्शन
रणनीतिक जोखिम
- रुझान में बदलाव का जोखिमः रुझान में बदलाव के बिंदु पर एक बड़ी वापसी हो सकती है
- बाज़ारों में उतार-चढ़ाव के लिए नहींः बाज़ारों में उतार-चढ़ाव के कारण झूठे संकेत मिल सकते हैं
- पैरामीटर संवेदनशीलताः विभिन्न पैरामीटर सेटिंग्स रणनीति के प्रभाव को काफी प्रभावित कर सकती हैं
- स्लाइड पॉइंट प्रभावः बार-बार लेनदेन स्लाइड पॉइंट से प्रभावित हो सकता है
- प्रणालीगत जोखिमः बाजार में होने वाली घटनाओं से भारी नुकसान हो सकता है
रणनीति अनुकूलन दिशा
- रुझान की ताकत को फ़िल्टर करनाः एडीएक्स जैसे रुझान की ताकत के संकेतकों को पेश करना, कमजोर रुझान संकेतों को फ़िल्टर करना
- ऑप्टिमाइज़ेशन स्टॉप लॉस सेटिंग्सः एटीआर गतिशीलता के आधार पर स्टॉप लॉस स्थिति को समायोजित करना, जोखिम नियंत्रण क्षमता में सुधार करना
- लेन-देन की पुष्टि जोड़ेंः लेन-देन विश्लेषण के संयोजन से प्रवृत्ति की प्रभावशीलता की पुष्टि करें
- उतार-चढ़ाव के लिए अनुकूलन का परिचयः बाजार में उतार-चढ़ाव के आधार पर गतिशील समायोजन पैरामीटर
- स्थिति प्रबंधन में सुधारः प्रवृत्ति की ताकत के आधार पर गतिशील रूप से स्थिति के आकार को समायोजित करना
संक्षेप
इस रणनीति का मुख्य लाभ यह है कि यह जटिल प्रवृत्ति विश्लेषण प्रक्रिया को दृश्यमान बनाता है, जिससे व्यापारियों को बाजार की गति को समझने में मदद मिलती है। उचित पैरामीटर अनुकूलन और जोखिम नियंत्रण उपायों के साथ, इस रणनीति का वास्तविक उपयोग करने के लिए अच्छा मूल्य है। व्यापारियों को सलाह दी जाती है कि वे वास्तविक समय में बाजार की स्थिति के विकल्पों पर ध्यान दें और अपनी जोखिम सहनशीलता के साथ स्थिति प्रबंधन करें।
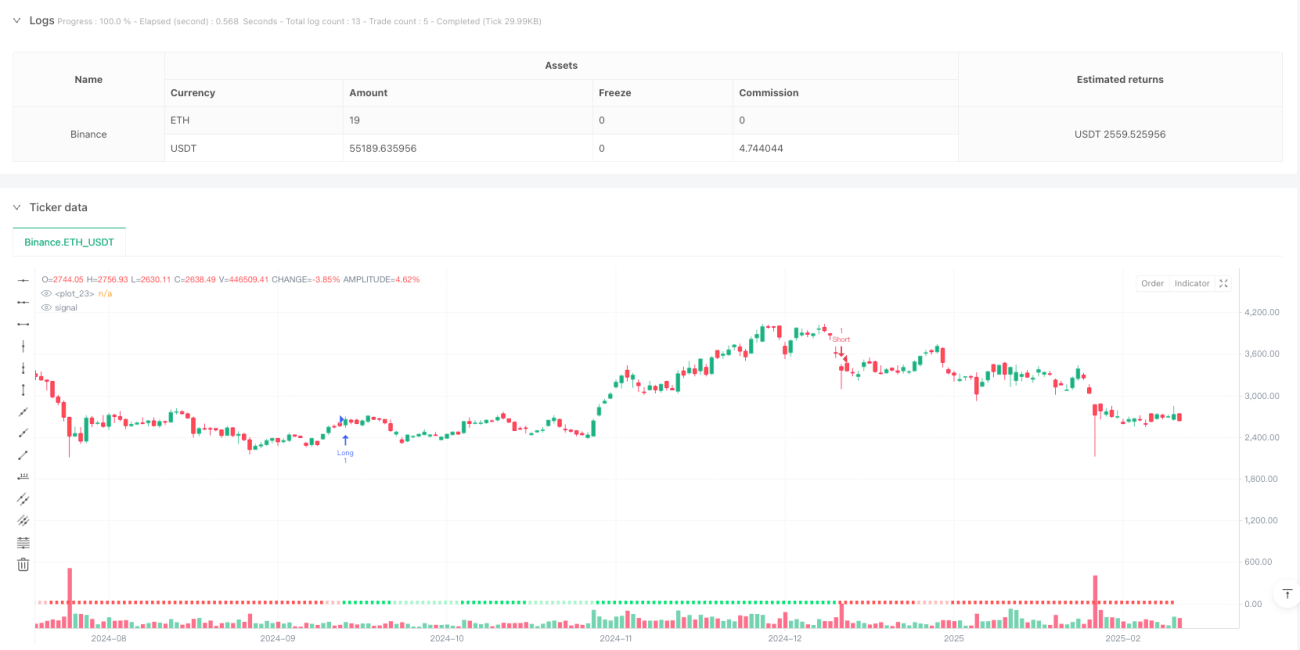
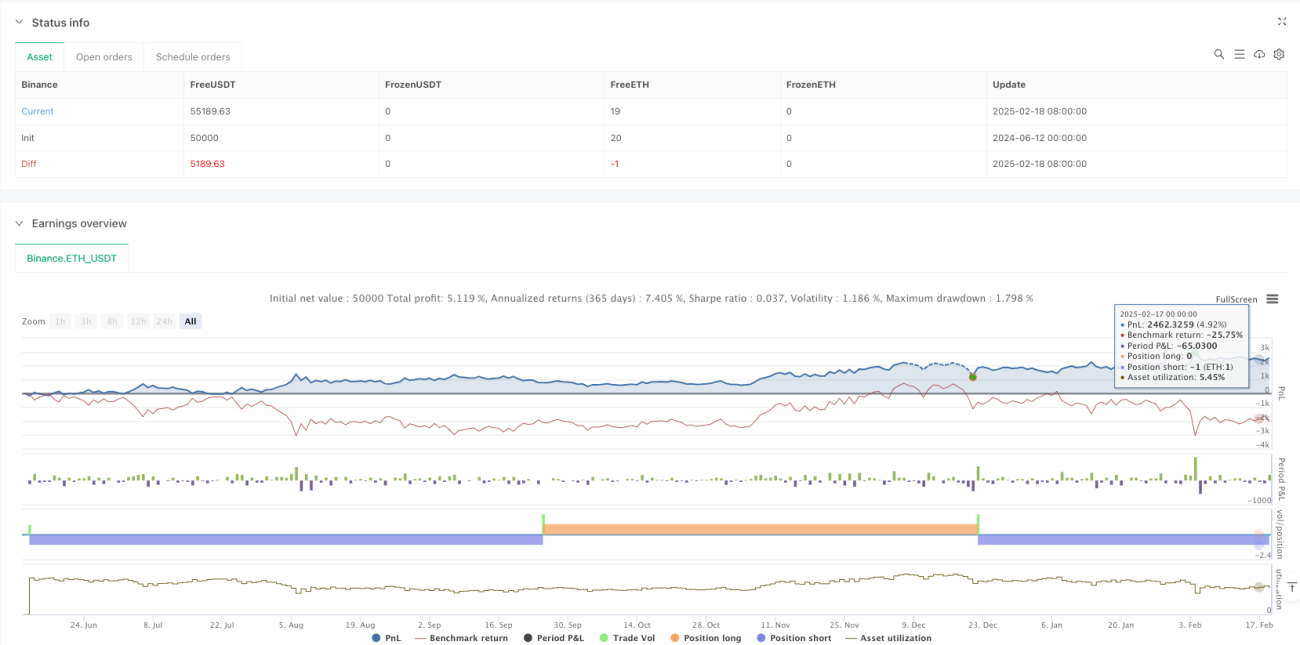
/*backtest
start: 2024-06-12 00:00:00
end: 2025-02-19 08:00:00
period: 1d
basePeriod: 1d
exchanges: [{"eid":"Binance","currency":"ETH_USDT"}]
*/

//@version=6
strategy("Donchian Trend Ribbon Strategy", shorttitle="DonchianTrendRibbonStrat", overlay=true, precision=0)

//~~~~~~~~~~~~~~~~~~~~~~~~~~~~~~~~~~~~~~~~~~~~~~~~~~~~~~~~~~~~~~~~~~~~~~~~~~~~~~- 1